Network diagram
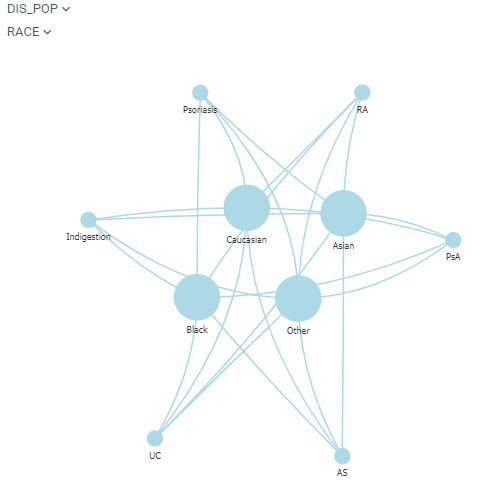
Network diagram visualizes graphs, where values of the specified two columns become nodes and rows become edges. You can color-code and size-code nodes and columns by choosing the aggregate function that applies to the values representing an edge or a node. Hover a node to see its column and value, the number of rows, and the values behind its size and color, if they are set.
developers
To add the viewer from the console, use:
grok.shell.tv.addViewer('Network diagram');
General:
| Right click | Context menu |
Videos
Properties
| Property | Type | Description |
|---|---|---|
| General | ||
| Node1 Column Name | string | |
| Node2 Column Name | string | |
| Edge Color Column Name | string | |
| Edge Color Aggr Type | string | |
| Edge Width Column Name | string | |
| Edge Width Aggr Type | string | |
| Node1 Size Column Name | string | |
| Node1 Size Aggr Type | string | |
| Node2 Size Column Name | string | |
| Node2 Size Aggr Type | string | |
| Node1 Color Column Name | string | |
| Node1 Color Aggr Type | string | |
| Node2 Color Column Name | string | |
| Node2 Color Aggr Type | string | |
| Node1 Image Column Name | string | |
| Node2 Image Column Name | string | |
| Node1 Label Column Name | string | |
| Node2 Label Column Name | string | |
| Node1 Shape | shapetype | |
| Node1 Color | number | |
| Node1 Img | string | put url, or url with placeholders ... to apply individual img |
| Node1 Physics | boolean | |
| Node2 Shape | shapetype | |
| Node2 Color | number | |
| Node2 Img | string | put url, or url with placeholders ... to apply individual img |
| Node2 Physics | boolean | |
| Merge Nodes | boolean | Merge same values from different columns into one node |
| Show Filtered Out Nodes | boolean | |
| Filtered Out Nodes Color | number | |
| Physics | boolean | |
| Suspend Simulation | boolean | |
| Miss Simulation | boolean | |
| Improved Layout | boolean | |
| Use Common Properties | boolean | |
| Use Google Image | boolean | |
| Node Shape | shapetype | |
| Node Img | string | |
| Node Color | number | |
| Edge Color | number | |
| Edge Width | number | |
| Show Arrows | arrowtype | |
| Edges Physics | boolean | |
| Selected Color | number | |
| Hover Color | number | |
| Show Column Selectors | boolean | |
| Select Rows On Click | boolean | |
| Select Edges On Click | boolean | |
| On Node Expand Function | string | Loads external data; called when you double-click on a node. The specified function gets called with the node value as a single argument. Its signature: dataframe expand(dynamic nodeId). |
| Allow Dynamic Menus | boolean | |
| Show Context Menu | boolean | Properties common for all viewers todo: use code generation |
| Title | string | |
| Description | string | Viewer description that gets shown at the Descriptor Position. Markup is supported. |
| Help | string | Help to be shown when user clicks on the '?' icon on top. Could either be in markdown, or a URL (starting with '/' or 'http'). |
| Description Position | flexposition | |
| Description Visibility Mode | visibilitymode | |
| Style | ||
| Auto Layout | boolean | |
| Edge Linear Color Scheme | list | |
| Edge Categorical Color Scheme | list | |
| Node1 Linear Color Scheme | list | |
| Node1 Categorical Color Scheme | list | |
| Node2 Linear Color Scheme | list | |
| Node2 Categorical Color Scheme | list | |
| Selection | ||
| Show Selected Rows | boolean | When checked, selected nodes and edges are highlighted using the selected rows color. When unchecked, they keep their regular color coding. |
| Description | ||
| Show Title | boolean | |
| Data | ||
| Table | string |
See also: