Pareto front viewer
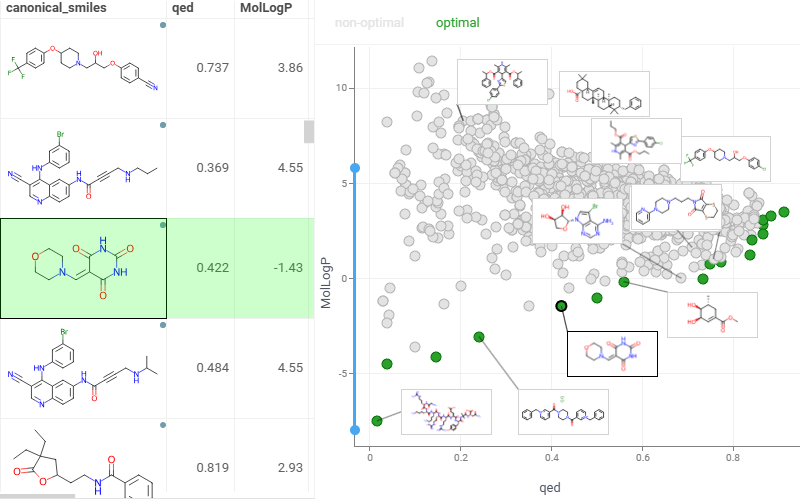
Pareto Front highlights a set of non-dominated solutions in a multi-objective optimization problem, where improving one objective will necessarily degrade at least one other objective. It represents the optimal trade-offs between conflicting goals, such as speed versus power consumption or production rate versus energy use.
Note: To use the Pareto front viewer, install the package EDA.
Add a Pareto front viewer
- On the menu ribbon, click the Add viewer icon. A dialog opens.
- In the dialog, select Pareto Front.
To add the viewer from the console, use:
grok.shell.tv.addViewer('Pareto front');
Initially, the viewer selects two numerical columns as objectives to be minimized. The resulting Pareto-optimal points are displayed on the scatter plot in green. By default, the viewer uses:
- The columns corresponding to the optimized features for the axes
- Category columns with unique values for the labels
Configuring the Pareto front viewer
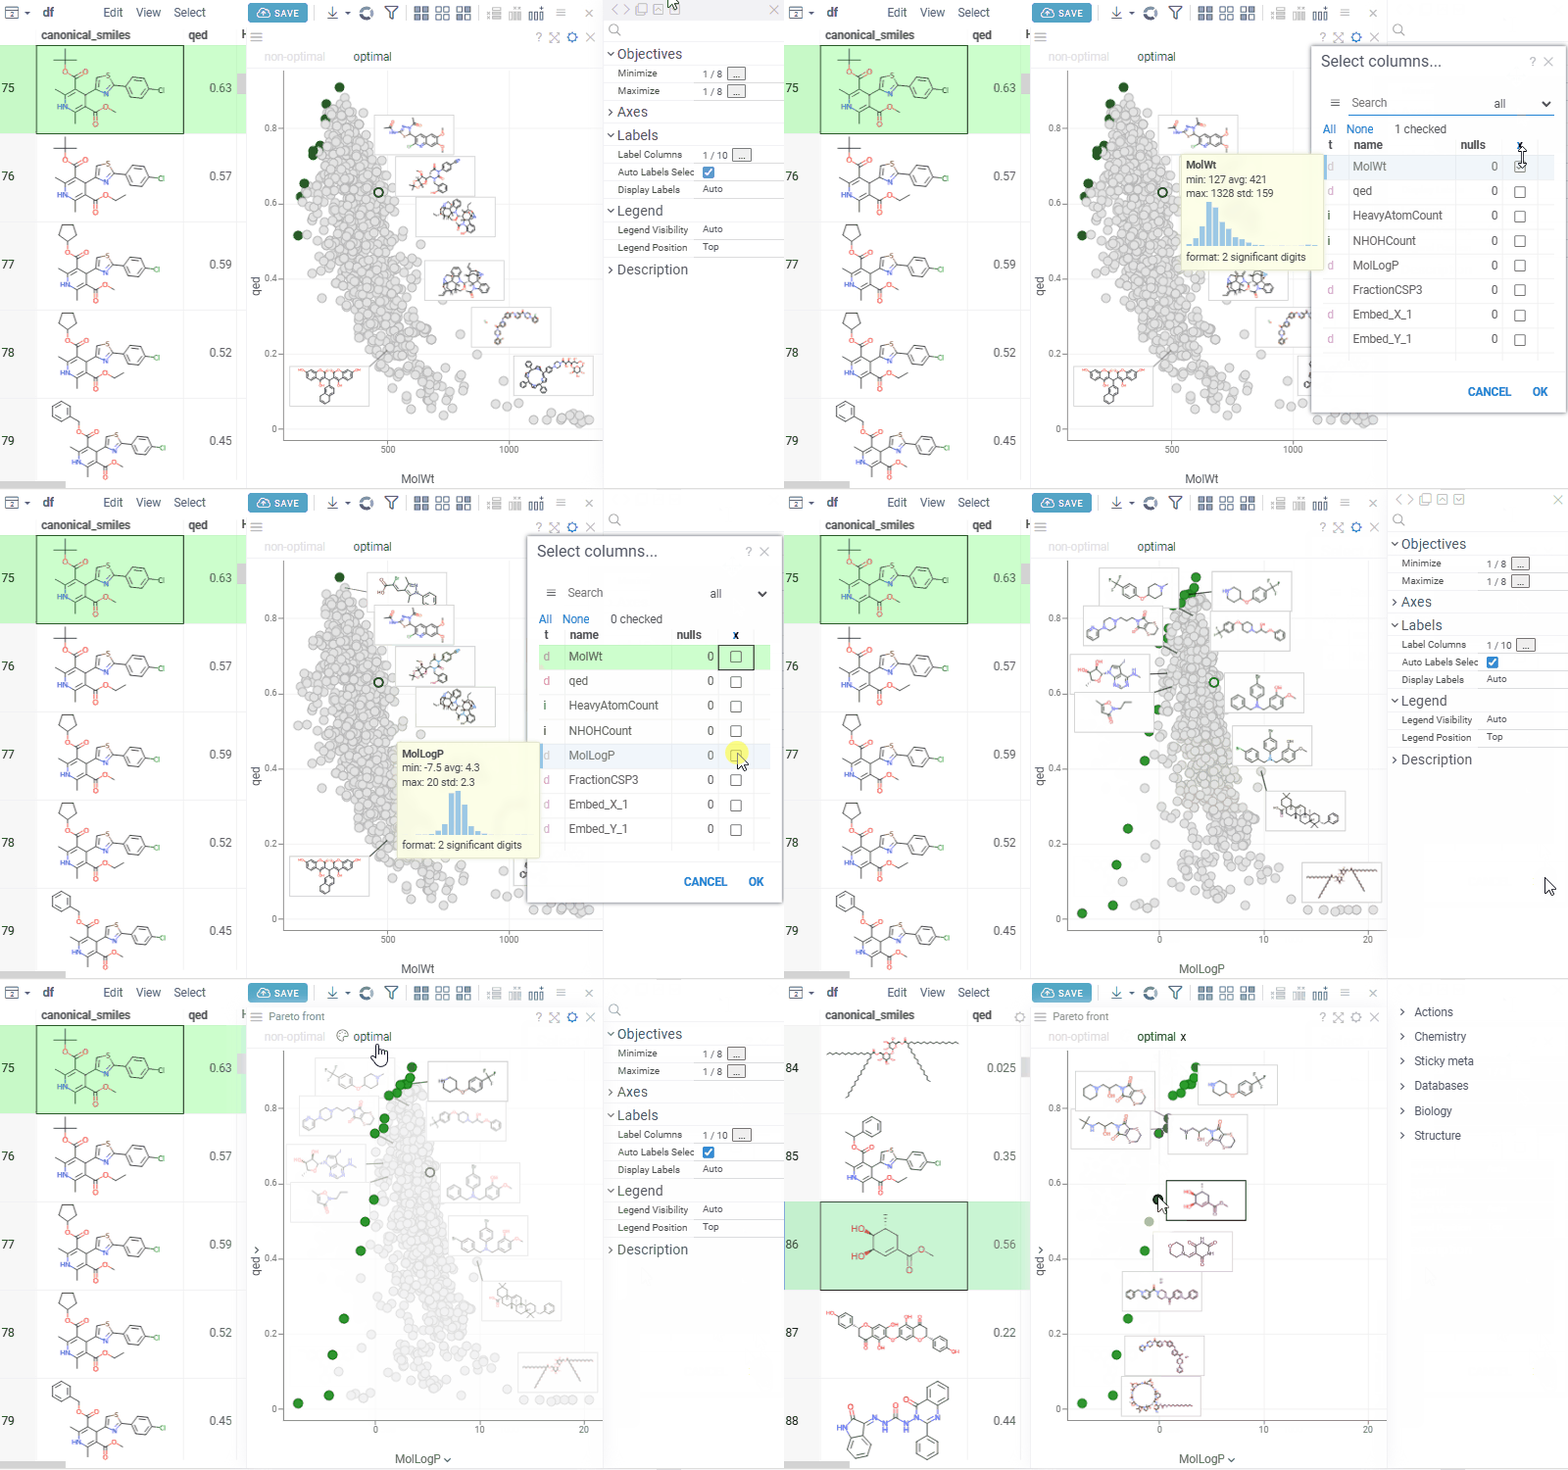
To configure the Pareto front, click the Gear icon on top of the viewer and use the info panels on the Context Panel. For example, you can:
- Specify the columns with objectives to minimize using the
Minimizeproperty. - Select the columns representing objectives to maximize using the
Maximizeproperty. - Customize the chart axes using the
X AxisandY Axisproperties. - Customize the label columns to display next to the markers using the
Label Columnsproperty.
Interactivity
The Pareto front viewer responds to row selection and data filtering. When you change the target columns, it performs multi-objective optimization and displays the resulting points on the chart.
Application
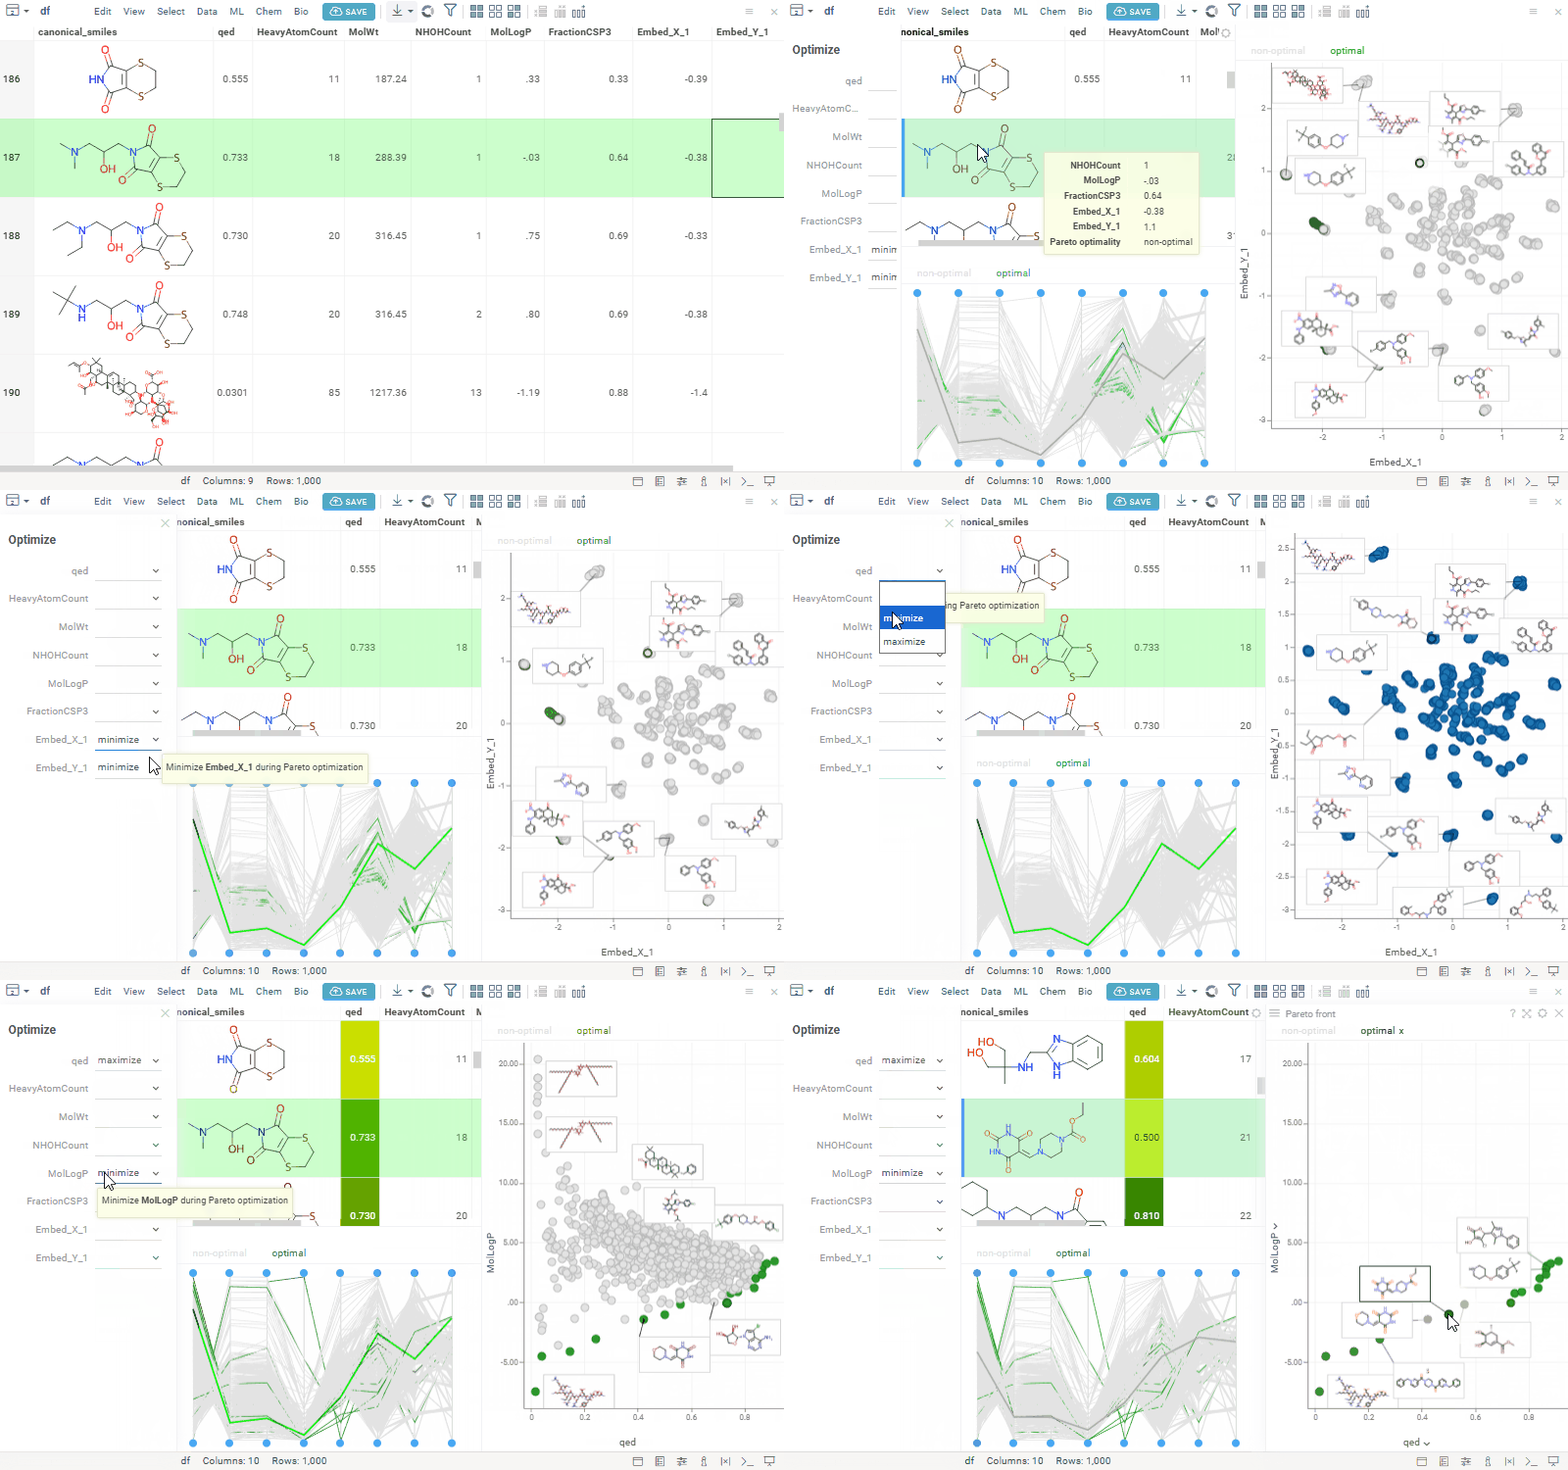
The Pareto Front application streamlines multi-parameter optimization by helping you identify optimal trade-offs between conflicting objectives.
To run the application:
-
Open a table containing the parameters you want to optimize.
-
Run Top Menu > ML > Pareto Front.... A view opens.
-
Configure optimization: In the left-side input panel, select the parameters to optimize and specify the type of optimization for each (e.g., maximize or minimize).
-
Explore results: The app automatically recalculates the results in real time. The optimization results are visualized using:
- The Pareto Front viewer, highlighting non-dominated solutions.
- PC plot, enabling analysis of trade-offs across all parameters.