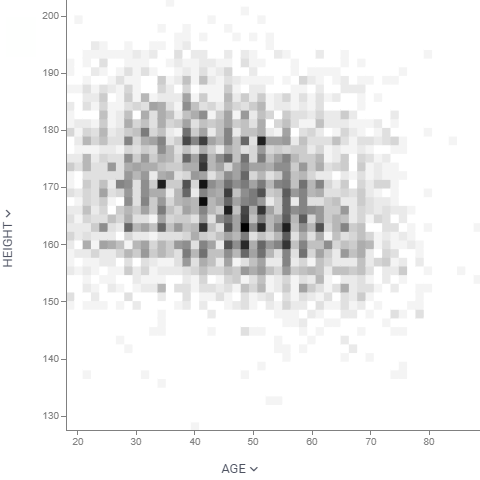
Density plot
Unlike scatter plot that visualizes each individual data point, density plot splits 2D area by bins, and color-codes it depending on the number of points that fall within this bin. The darker the color, the more points it contains.
developers
To add the viewer from the console, use:
grok.shell.tv.addViewer('Density plot');
General:
| Right click | Context menu |
Axes
To set the range of an axis, use Min and Max in the X Axis or Y Axis section of the Context Panel. To highlight thresholds and areas of interest, add formula lines and annotation regions.
Properties
| Property | Type | Description |
|---|---|---|
| General | ||
| Bin Shape | string | |
| X Column Name | string | Columns to be put on the X axis |
| Y Column Name | string | Columns to be put on the Y axis |
| Allow Zoom | boolean | |
| Bin To Range | boolean | |
| Show Bin Selector | boolean | |
| Back Color | number | |
| Lasso Tool | boolean | When true, lasso area selector is used instead of the rectangular one when drawing annotation regions. |
| Row Source | string | Determines the rows shown on the plot. |
| Allow Dynamic Menus | boolean | |
| Show Context Menu | boolean | Properties common for all viewers todo: use code generation |
| Title | string | |
| Description | string | Viewer description that gets shown at the Descriptor Position. Markup is supported. |
| Help | string | Help to be shown when user clicks on the '?' icon on top. Could either be in markdown, or a URL (starting with '/' or 'http'). |
| Description Position | flexposition | |
| Description Visibility Mode | visibilitymode | |
| X Axis | ||
| Show X Axis | boolean | |
| X Axis Type | string | |
| Invert X Axis | boolean | |
| Show X Selector | boolean | |
| X Min | number | |
| X Max | number | |
| Y Axis | ||
| Show Y Axis | boolean | |
| Y Axis Type | string | |
| Invert Y Axis | boolean | |
| Show Y Selector | boolean | |
| Y Min | number | |
| Y Max | number | |
| Color | ||
| Show Color Scale | boolean | |
| Invert Color Scheme | boolean | |
| Color Transform Type | string | |
| Linear Color Scheme | list | |
| Style | ||
| Auto Layout | boolean | |
| Axis Font | string | |
| Annotation Font | string | |
| Formula Font | string | |
| Controls Font | string | Viewer controls elements font. |
| Misc | ||
| Bins | number | |
| Annotations | ||
| Show Viewer Annotation Regions | boolean | |
| Show Dataframe Annotation Regions | boolean | |
| Show Viewer Formula Lines | boolean | Control the visibility of viewer-level formula lines. Edit formula lines by right-clicking and selecting "Tools | Formula Lines" from the popup menu. Requires the PowerPack plugin. |
| Show Dataframe Formula Lines | boolean | Control the visibility of dataframe-originated formula lines. Edit formula lines by right-clicking and selecting "Tools | Formula Lines" from the popup menu. Requires the PowerPack plugin. |
| Data | ||
| Filter | string | Formula that filters out rows to show. Examples: ${AGE} > 20 or ${WEIGHT / 2)} > 100, ${SEVERITY} == 'Medium', ${RACE}.endsWith('sian') |
| Table | string | |
| Description | ||
| Show Title | boolean |
See also: