Bar chart
A bar chart presents grouped data as rectangular bars with lengths proportional to the values that they represent. Unlike histograms which you can apply to display the distribution of numerical data, bar charts are primarily designed for categorical values.
To add the viewer from the console, use:
grok.shell.tv.addViewer('Bar chart');
| Click on a bar | Select or filter |
| Right click | Context menu |
| Double-click | Reset View |
| Alt+drag | Zoom |
| Alt+F | Show in full screen |
Features
Stacked bars and relative values
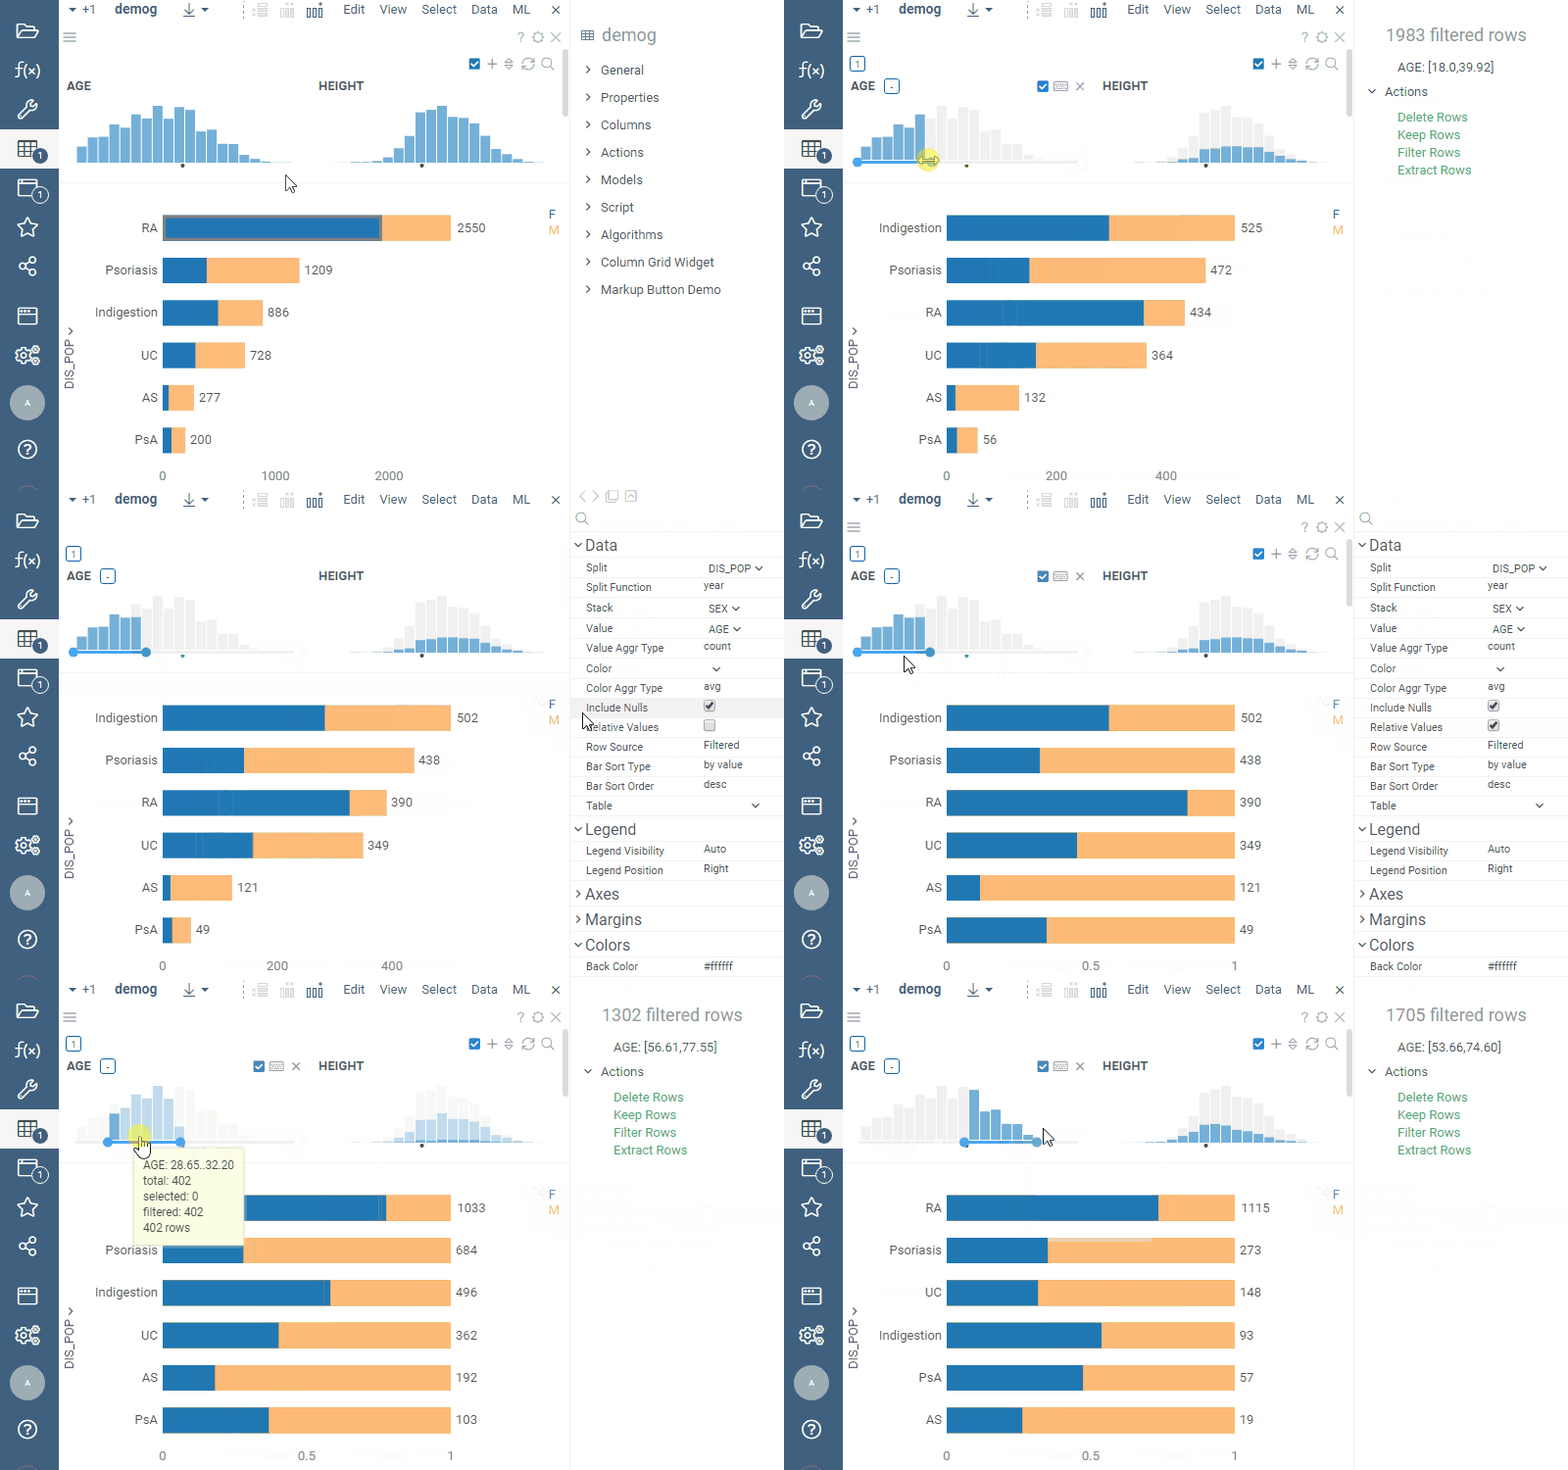
Use the 'Relative Values' property in combination with the 'Stack' property to analyze the distribution of the stacked values:
Value axis range
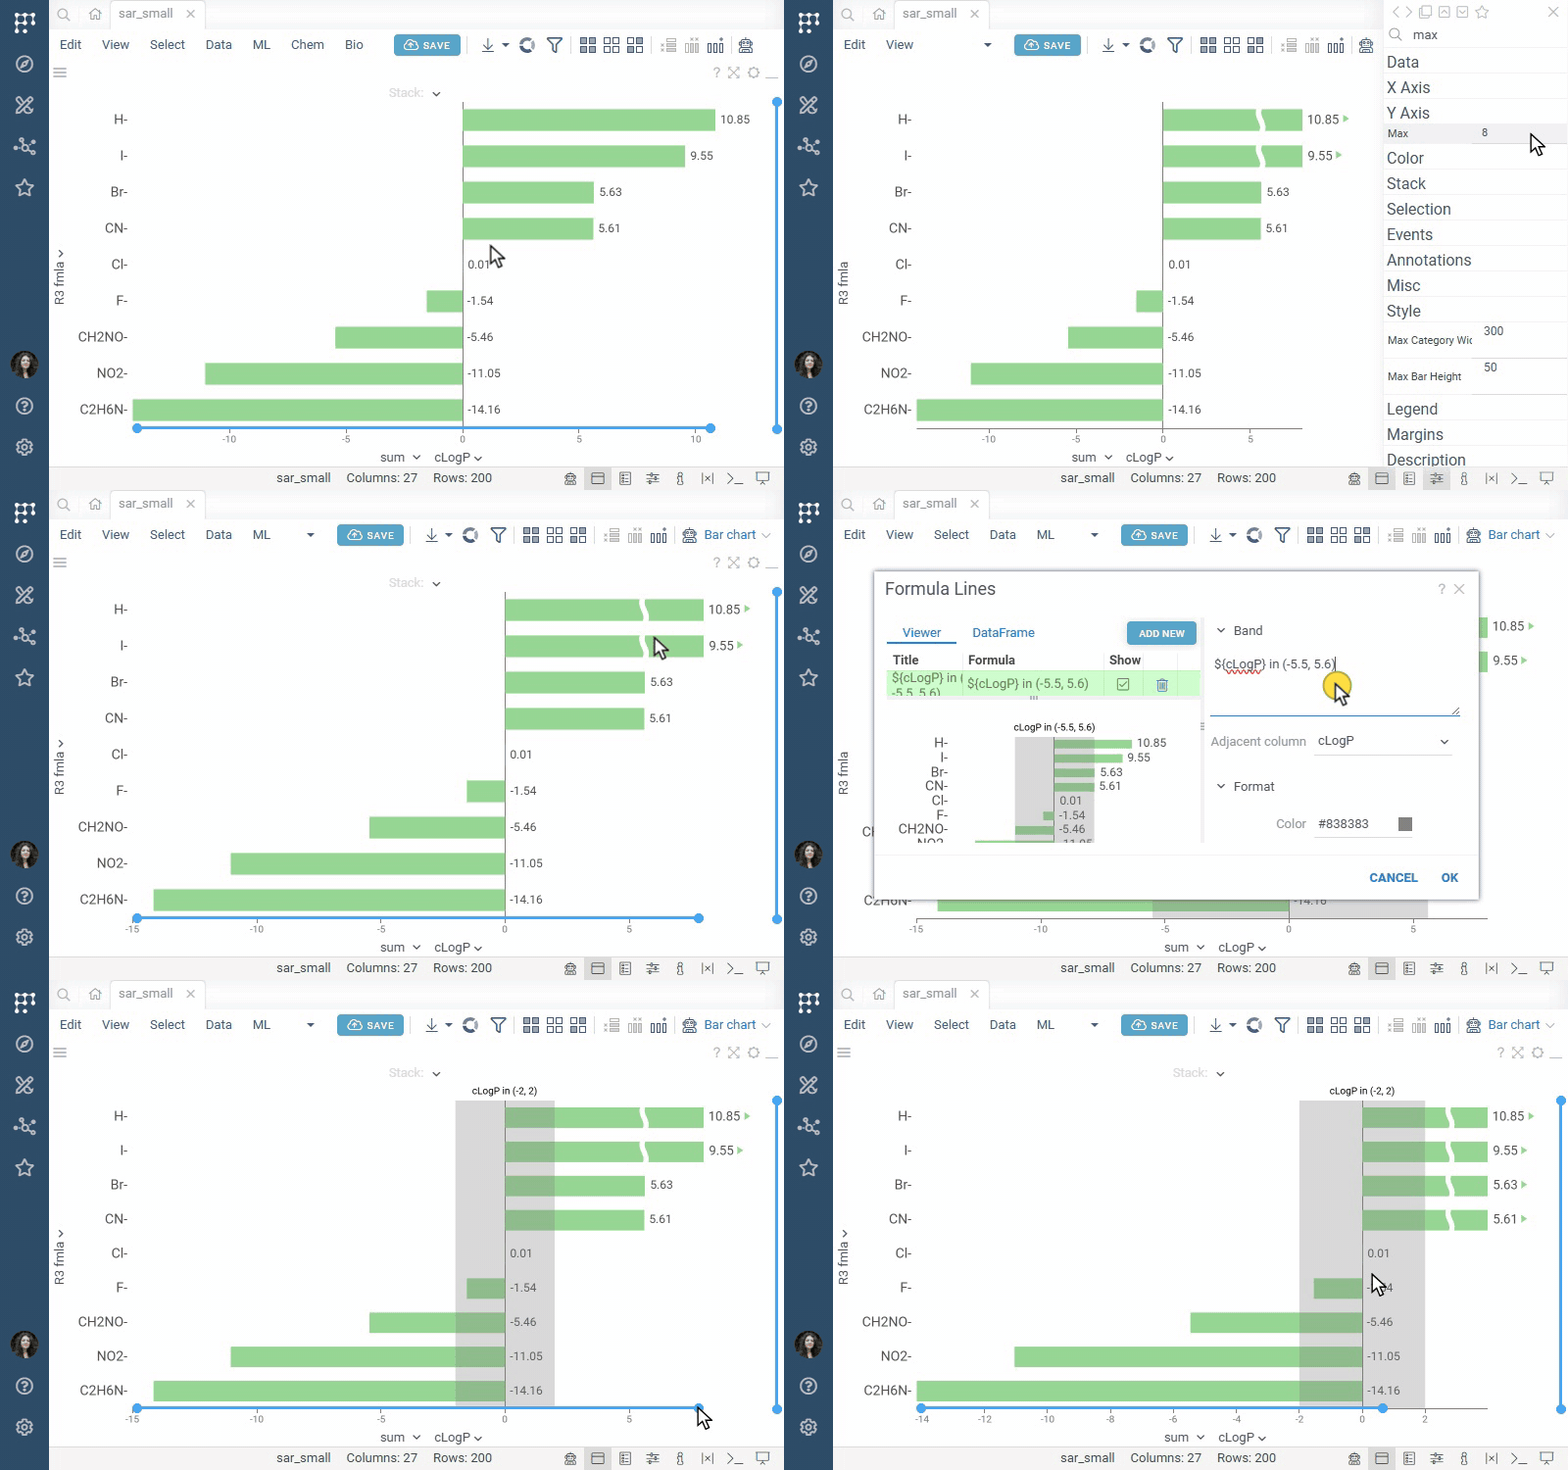
To set the range of the value axis, use Min and Max in the Y Axis section of the Context Panel. To change the range on the fly, hover over the value axis and drag the ends of the range slider. Bars that don't fit into the range are clipped and marked with a wavy break and an arrow. To hide the marks, clear Show Clipped Bar Indicators.
To mark a value or range of values, right-click the value axis and select Annotations, then choose Add Line, Add Band, or Add Region. For details, see Formula lines and Annotation regions.
Dates and years, quarters, months
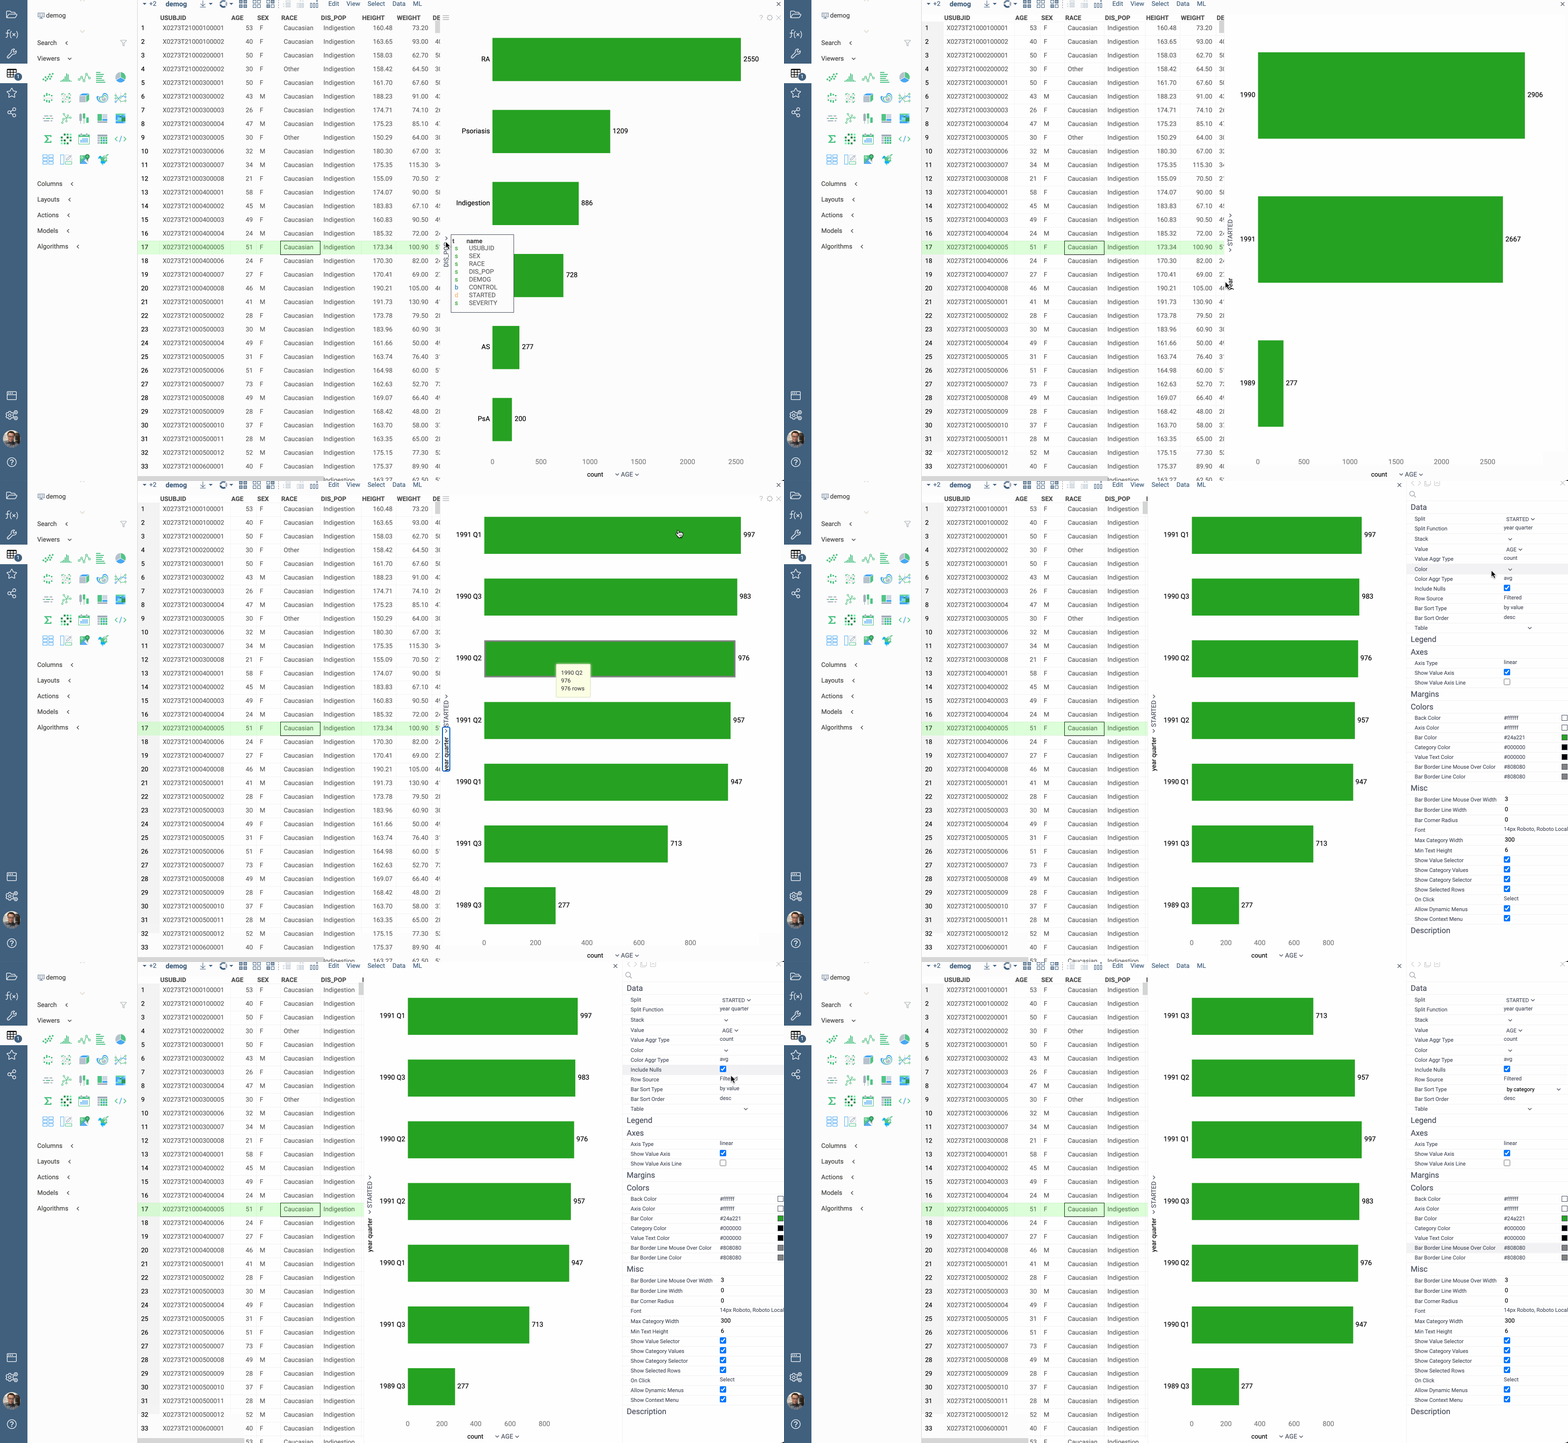
You can categorize DateTime columns using special functions, such as 'Year', 'Month', 'Quarter', ' Year - Month' and 'Year - Quarter':
Videos
Properties
| Property | Type | Description |
|---|---|---|
| Data | ||
| Row Source | string | Determines the rows shown on the scatter plot. |
| On Click | string | Determines what happens when you click on a bar. |
| Filter | string | Formula that filters out rows to show. Examples: ${AGE} > 20 or ${WEIGHT / 2)} > 100, ${SEVERITY} == 'Medium', ${RACE}.endsWith('sian') |
| Table | string | |
| X Axis | ||
| Split Column Name | string | A categorical column to split data on (each bar represents a category) |
| Split Map | string | Time unit map function for Split (applicable to dates only). |
| Show Category Values | boolean | |
| Show Values Instead Of Categories | boolean | |
| Show Category Selector | boolean | |
| Y Axis | ||
| Value Column Name | string | Value column. See Value Aggr Type for aggregation options. |
| Value Aggr Type | string | Value aggregation. |
| Relative Values | boolean | When true, each outermost bar is of the same width. This mode is useful for comparing relative value frequency when the Stack column is specified. |
| Include Nulls | boolean | Indicates whether the "no data" bar should appear when the Split value is not present. |
| Bar Sort Type | string | Whether to sort bars by category or by value. See also Bar Sort Order |
| Bar Sort Order | string | Whether the bars should be sorted in ascending or descending order. See also Bar Sort Type. |
| Axis Type | string | |
| Value Min | number | |
| Value Max | number | |
| Show Value Axis | boolean | |
| Show Value Selector | boolean | |
| General | ||
| Orientation | string | |
| Show Mouse Over Rect | boolean | |
| Show Filtered Rows | boolean | Show which part is filtered Only works with RowSource = All |
| Show Mouse Over Rows | boolean | |
| Back Color | number | |
| Axis Color | number | |
| Bar Color | number | |
| Category Color | number | |
| Value Text Color | number | |
| Bar Border Line Mouse Over Color | number | |
| Bar Border Line Filtered Color | number | |
| Bar Border Line Color | number | |
| Outer Margin Left | number | |
| Outer Margin Right | number | |
| Outer Margin Top | number | |
| Outer Margin Bottom | number | |
| Show Empty Bars | boolean | Indicates whether categories with no matching rows should appear as zero-height bars. |
| Show Labels | string | |
| Allow Dynamic Menus | boolean | |
| Show Context Menu | boolean | Properties common for all viewers todo: use code generation |
| Title | string | |
| Description | string | Viewer description that gets shown at the Descriptor Position. Markup is supported. |
| Help | string | Help to be shown when user clicks on the '?' icon on top. Could either be in markdown, or a URL (starting with '/' or 'http'). |
| Description Position | flexposition | |
| Description Visibility Mode | visibilitymode | |
| Color | ||
| Color Column Name | string | Numerical column to be used for color-coding. The values in the bin get aggregated using the Color Aggr Type property. |
| Color Aggr Type | string | Color aggregation type. |
| Invert Color Scheme | boolean | |
| Linear Color Scheme | list | |
| Stack | ||
| Stack Column Name | string | A categorical column to further split data on. Each category would become a part of the bar resulting from Split. Shows stacked bars only when Value Aggr Type is additive. |
| Stack Map | string | Time unit map function for Stack (applicable to dates only). |
| Show Stack Selector | boolean | |
| Show Stack Percentage | boolean | Shows the share of each stack segment in its bar, in percent, when the segment fits the label. |
| Selection | ||
| Show Selected Rows | boolean | Whether the selected rows are indicated. Only works for cumulative aggregations such as count. |
| Style | ||
| Auto Layout | boolean | |
| Max Category Width | number | |
| Category Value Width | number | |
| Show Value Axis Line | boolean | |
| Show Category Zero Baseline | boolean | |
| Bar Border Line Mouse Over Width | number | |
| Bar Border Line Width | number | |
| Max Bar Height | number | |
| Bar Corner Radius | number | |
| Vertical Align | verticalaligntype | |
| Font | string | |
| Axis Font | string | |
| Min Text Height | number | |
| Show Clipped Bar Indicators | boolean | When enabled, shows hatched areas and arrows on bars that are clipped by the value axis range. |
| Annotation Font | string | |
| Formula Font | string | |
| Controls Font | string | Viewer controls elements font. |
| Annotations | ||
| Show Viewer Annotation Regions | boolean | |
| Show Dataframe Annotation Regions | boolean | |
| Show Viewer Formula Lines | boolean | Control the visibility of viewer-level formula lines. Edit formula lines by right-clicking and selecting "Tools | Formula Lines" from the popup menu. Requires the PowerPack plugin. |
| Show Dataframe Formula Lines | boolean | Control the visibility of dataframe-originated formula lines. Edit formula lines by right-clicking and selecting "Tools | Formula Lines" from the popup menu. Requires the PowerPack plugin. |
| Legend | ||
| Legend Visibility | visibilitymode | |
| Legend Position | flexautoposition | |
| Description | ||
| Show Title | boolean |
See also: