Analysis of variances
Analysis of variance (ANOVA) determines whether the examined factor has a significant impact on the studied feature.
- Open a table.
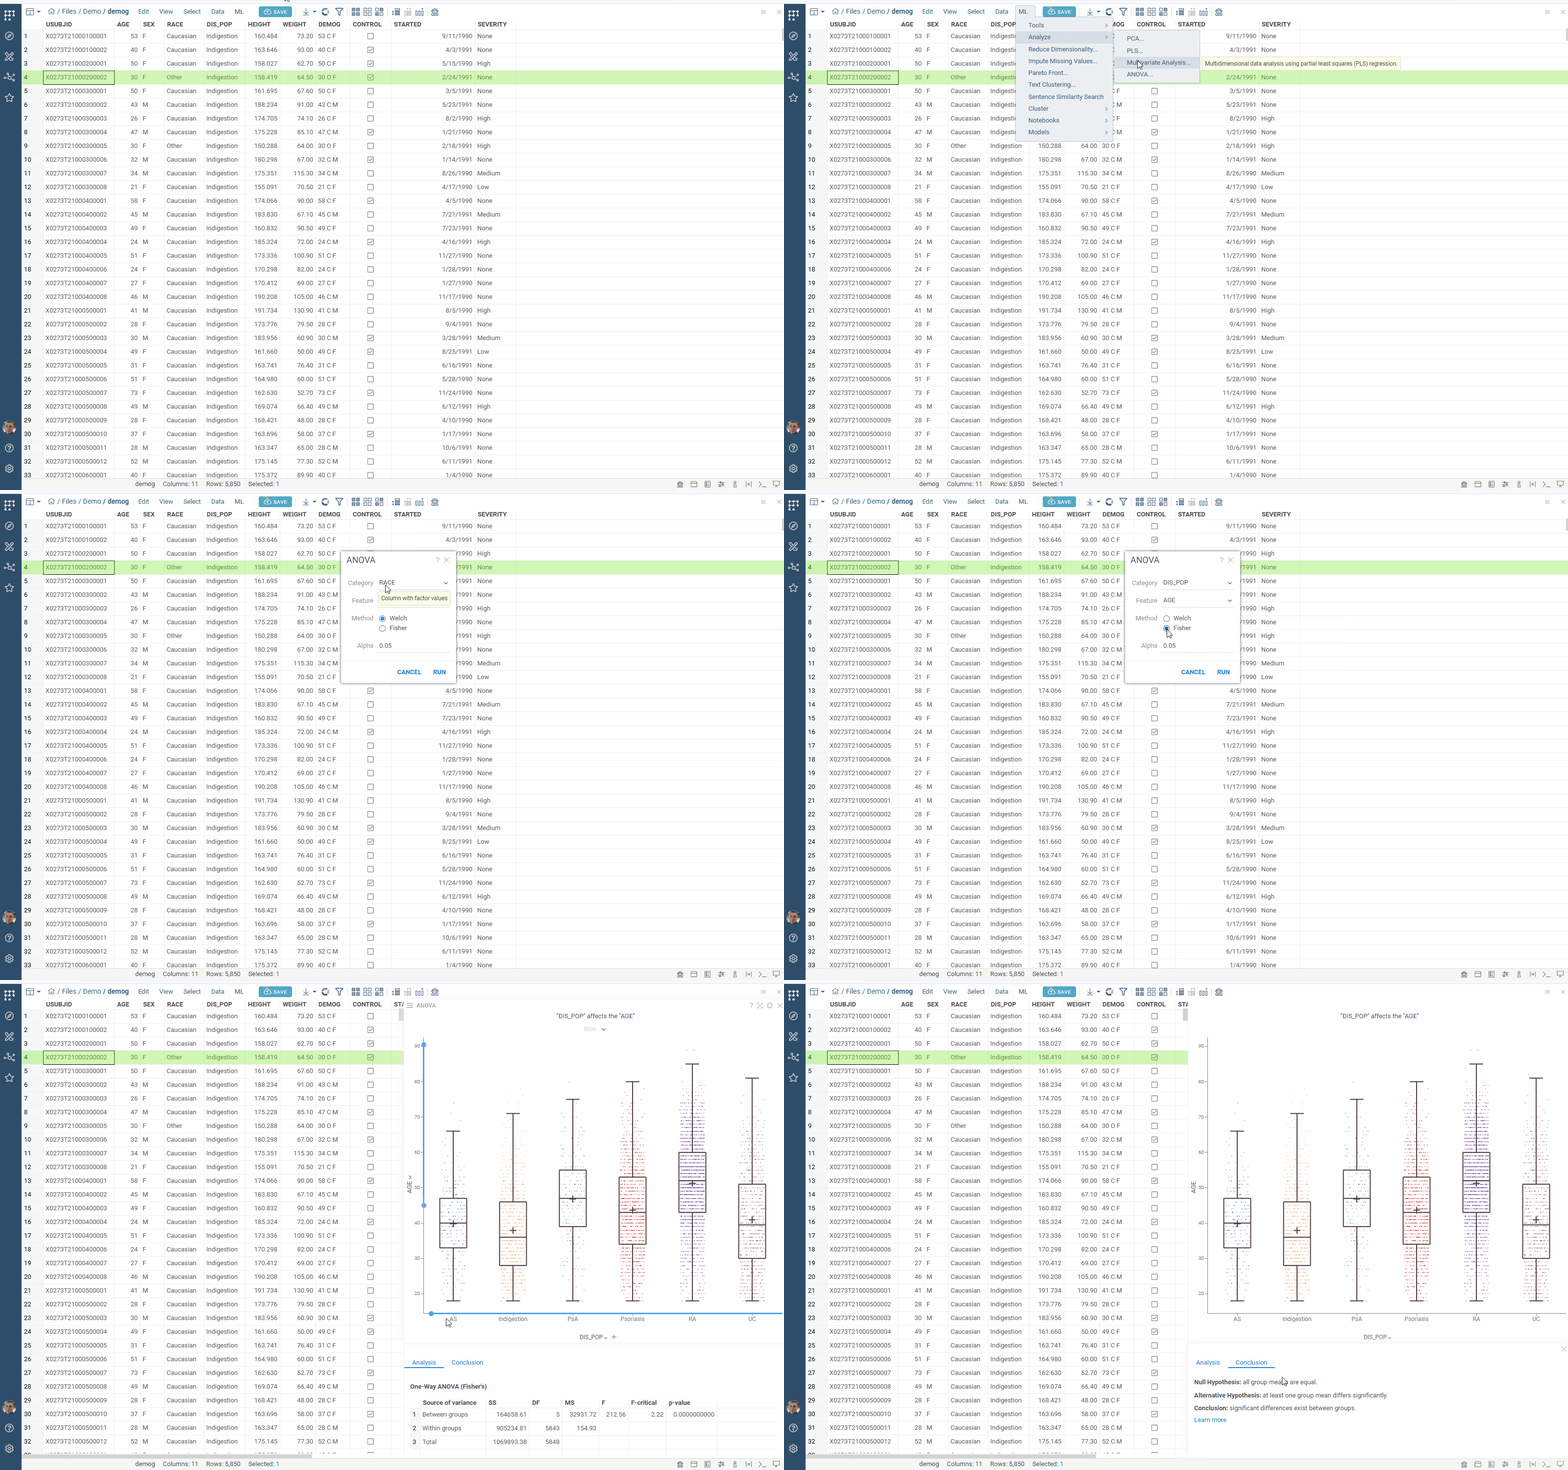
- Run Top Menu > ML > Analyze > ANOVA.... A dialog opens.
- In the dialog, specify:
- the column with factor values (in the
Categoryfield) - the column with feature values (in the
Featurefield) - the analysis method (in the
Methodfield):WelchorFisher - the significance level (in the
Alphafield)
- the column with factor values (in the
- Click
Runto execute. The following analysis appears:
Datagrok supports two one-way ANOVA methods:
- Welch (default) - robust to unequal variances across groups. Recommended unless you have strong reason to assume equal variances.
- Fisher - classical ANOVA. More powerful when variances are equal, but unreliable otherwise. You can't run the analysis if group variances differ significantly - switch to Welch in that case.
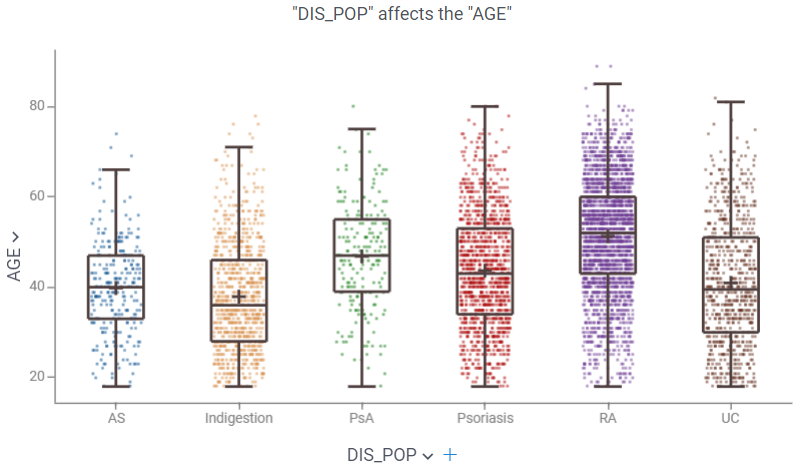
The box plot shows the distribution of values by categories:
The Analysis tab presents a table with ANOVA computations:

The Fisher and Welch methods show different columns:
- Fisher: sums of squares (SS), degrees of freedom (DF), mean squares (MS), F-statistic, critical F-value, and p-value - split into Between groups, Within groups, and Total.
- Welch: F-statistic, numerator df (k − 1), Welch–Satterthwaite denominator df (fractional), critical F-value, and p-value - Welch's test has no SS/MS decomposition by design.
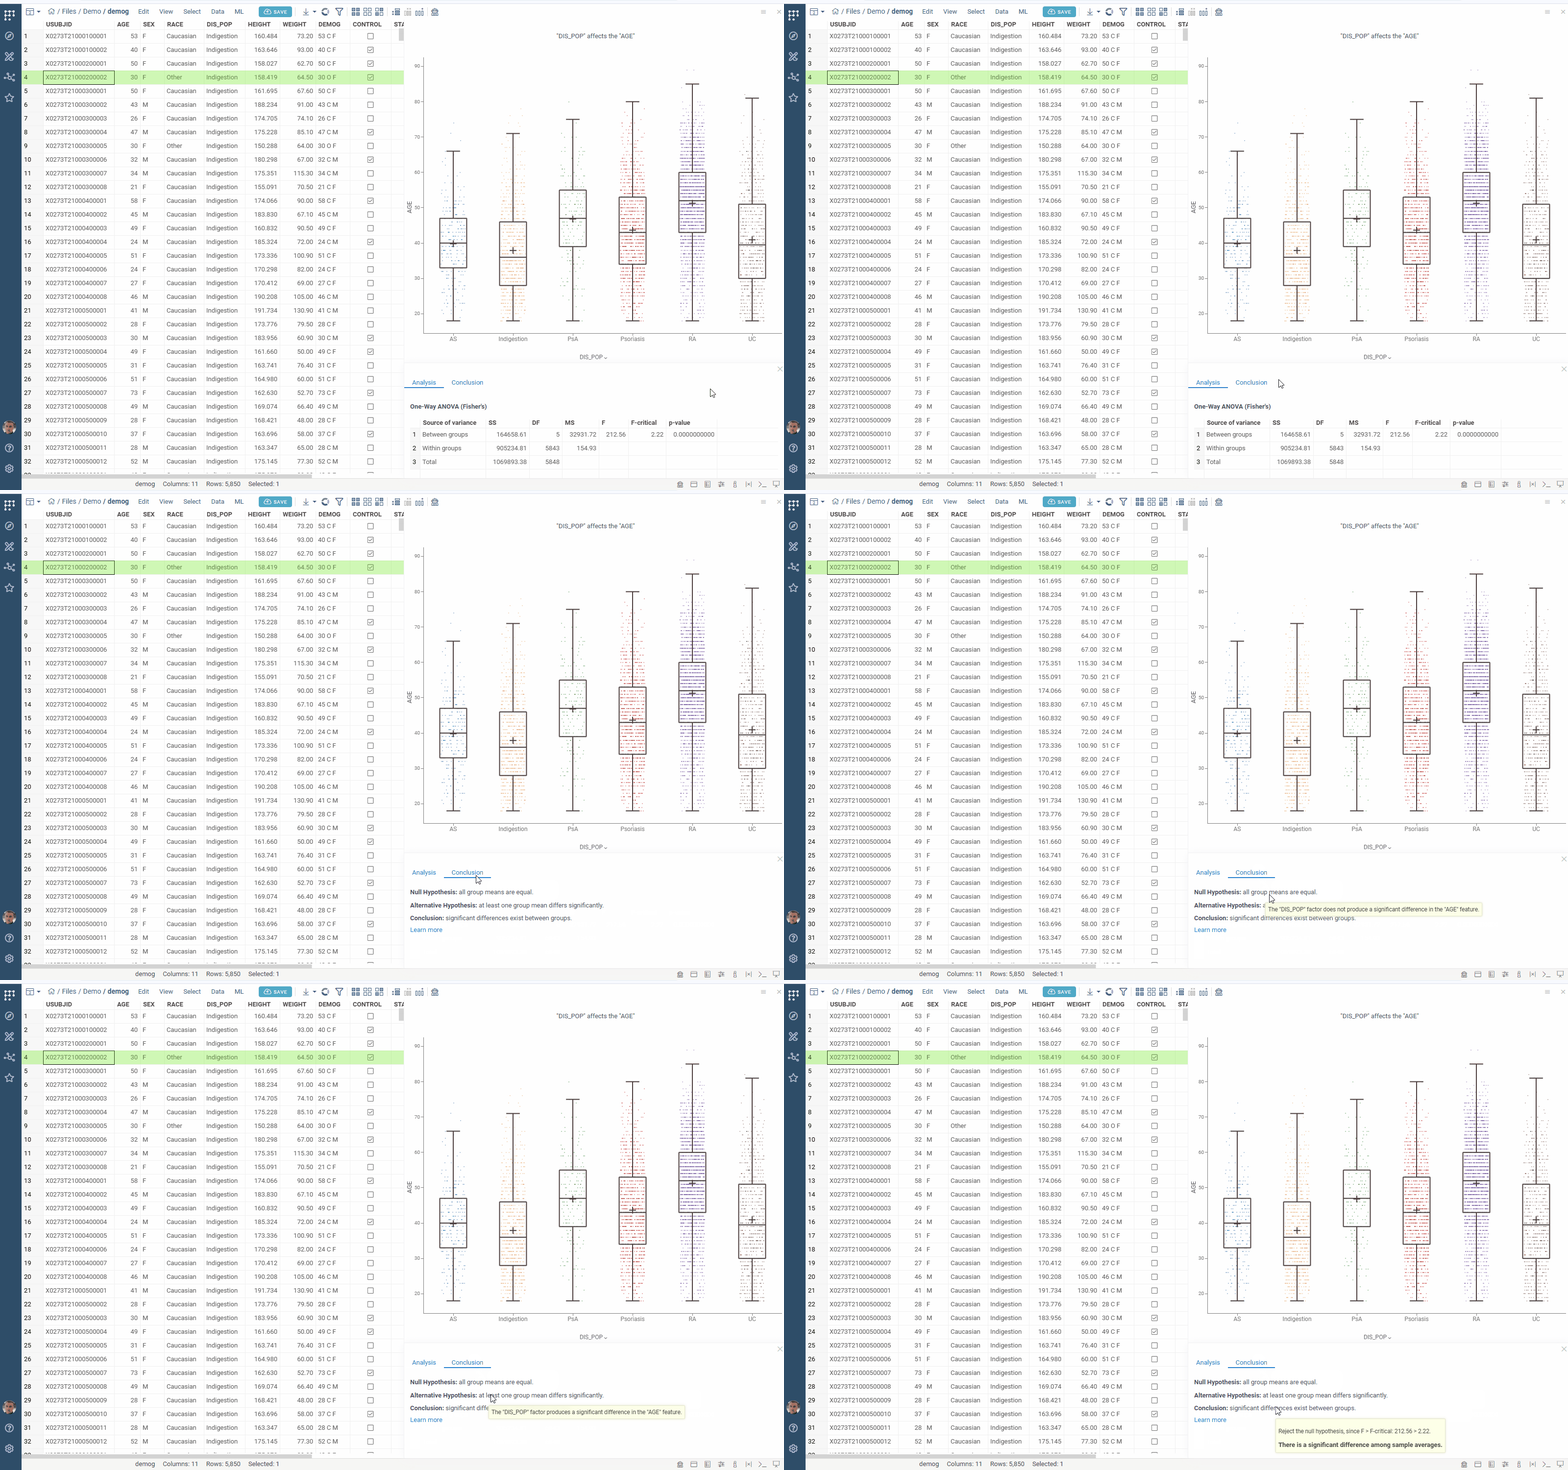
Click the Conclusion tab to explore the null hypothesis testing:
See also: