What's new
See details: issues, plugin changelogs, JS API compatibility Community: Plugin releases, Platform releases
1.27.0 || 2026-Mar
Visualization and analysis
| Scatterplot: Highlight and annotate areas of interest directly on the scatterplot and line chart with new annotation regions. They support overlapping, data selection, and work consistently with log scales, inverted axes, and axis transformations. Learn more: scatterplot, line chart | 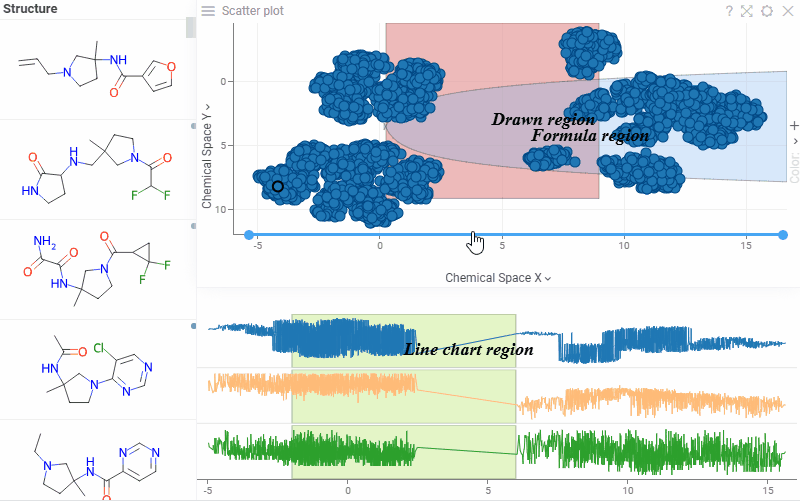 |
Scatterplot: Control whether selected rows are visually highlighted on the plot with the new Show Selected Rows property. Note: for Row Sources Selected and Filtered Selected, color highlighting does not occur regardless of this setting |  |
| Scatterplot: Explore the distribution of each axis variable with Show X/Y Histograms property, which displays histograms along the scatterplot axes | 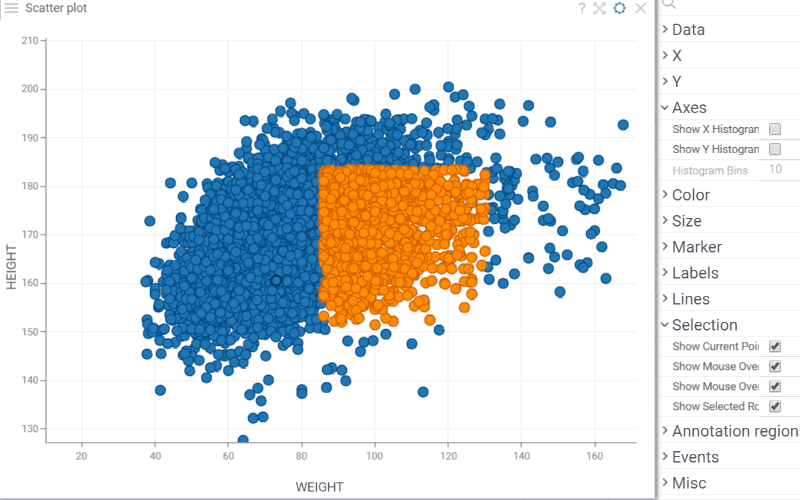 |
| Scatterplot: Control line grouping and coloring independently with the new Lines By property. For example, lines can represent individual patients or experiments while color reflects treatment group or status | 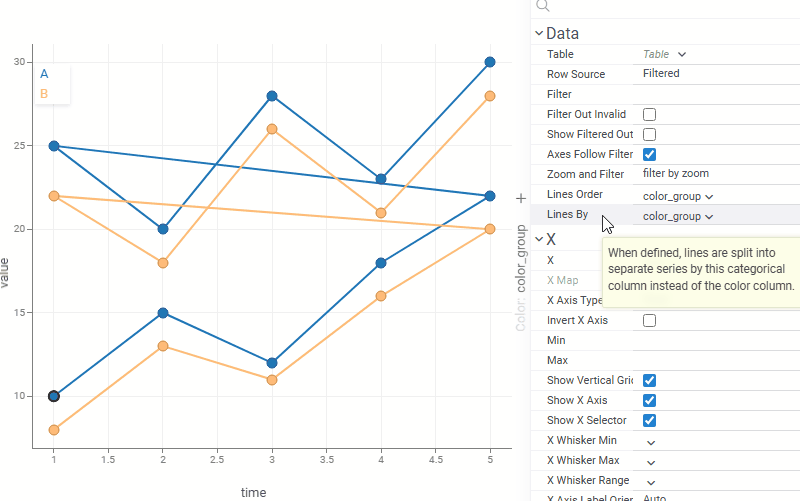 |
| Scatterplot: Regression statistics (equation, r², ρ, r, MAE) are now interactive — hover over any statistic to see a tooltip with its description, or click it to open the corresponding Wikipedia page | 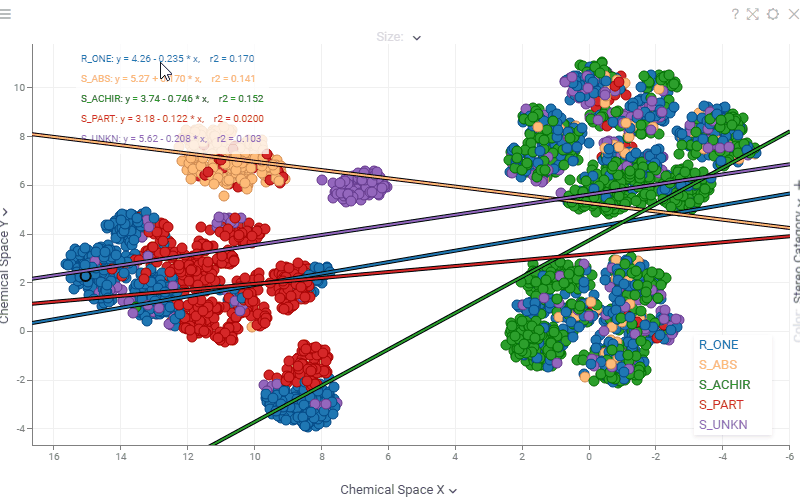 |
| Grid: Color one column by another with the new Linked color coding scheme — it reuses the reference column's color scheme regardless of the target column's data type Learn more |  |
| Grid: Blur column values to safely share screenshots without exposing sensitive data using the new Blur rendering option. Enable via Context Panel > Settings > Blur content |  |
| Grid: Visualize confidence intervals directly in grid cells with the new Confidence interval renderer |  |
| Grid: New Stars cell renderer for rating-style columns |  |
| Histogram: Display the bin count on top of each bar with the new Show Values property. The value reflects the current row source (filtered, selected, or all rows) | 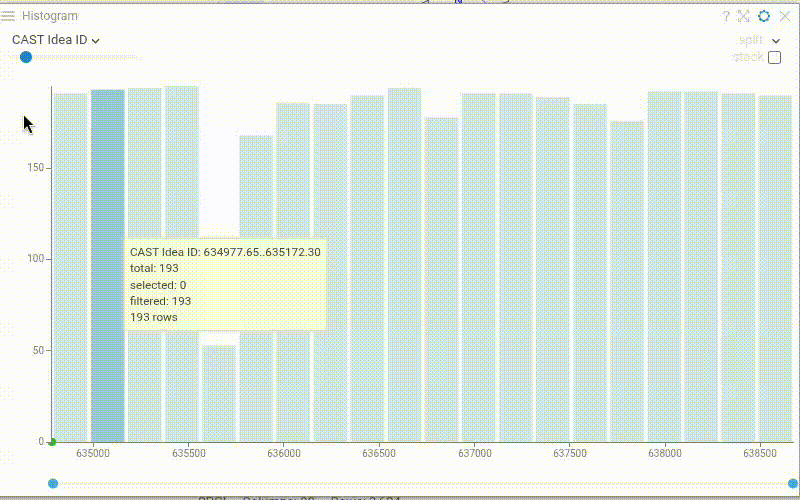 |
| Histogram: Overlay distribution curves over the histogram bars with Show Distribution Lines. Works with stacked bins, splines, and filled splines. Requires a Split Column to be defined | 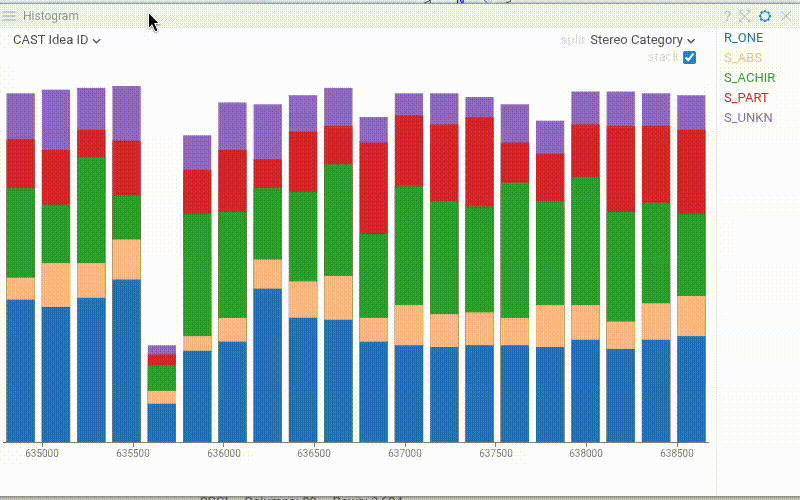 |
| Pie chart: Labels are now displayed outside the slices for better readability when working with many categories | 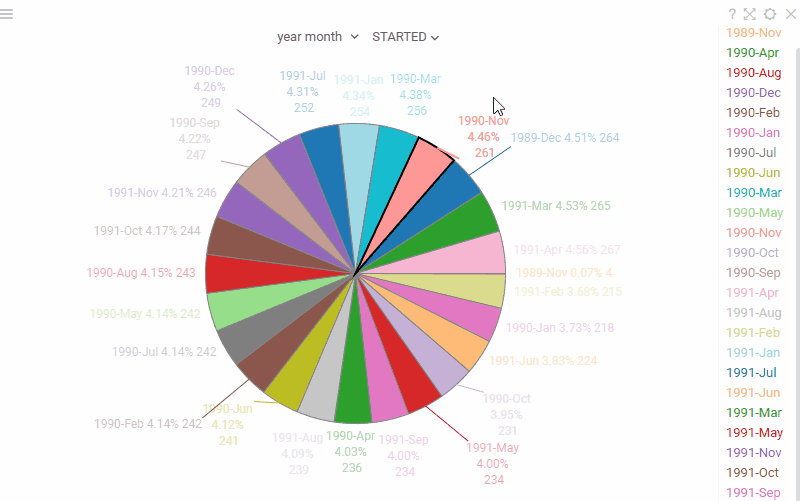 |
| Trellis plot: Customize the color scheme for the inner heatmap viewer with the new Color Scheme setting (Context Panel > Heatmap > Style). The heatmap also automatically picks up color coding from the grid, which takes priority over the selected scheme | 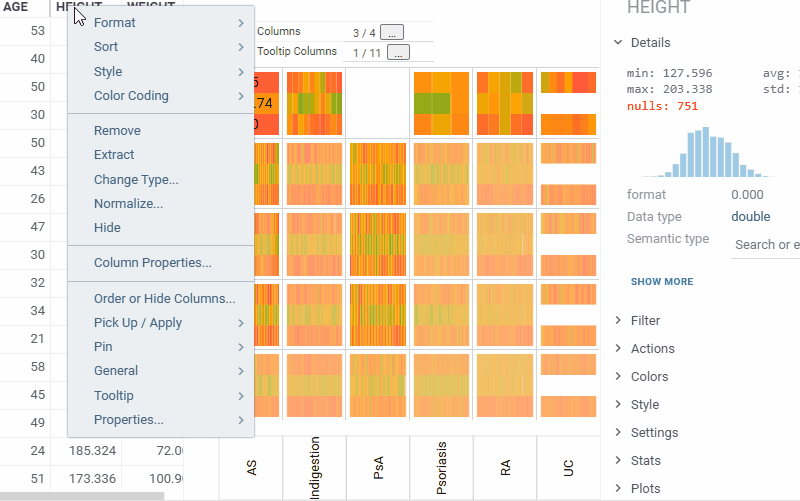 |
| Filter panel: Filter columns that contain multiple values per cell with the new Multi-value filter | 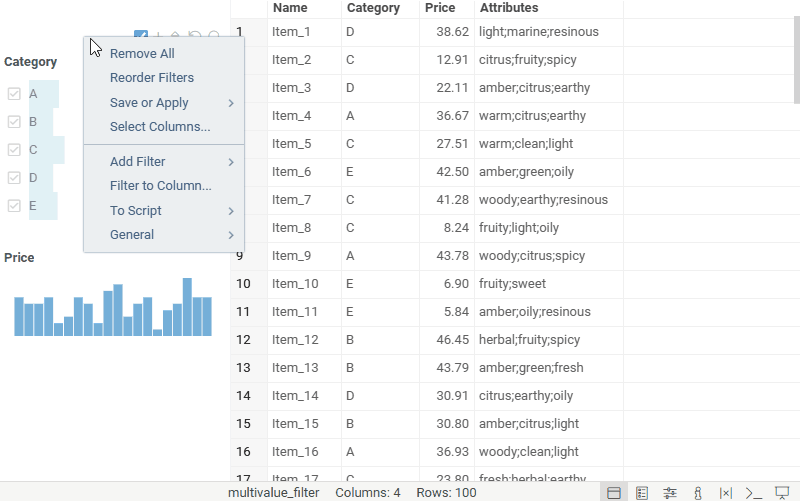 |
| Filter panel: Switch a numeric filter to a categorical filter and back — the selected type persists in the layout and the project. Use the filter type toggle in the filter header | 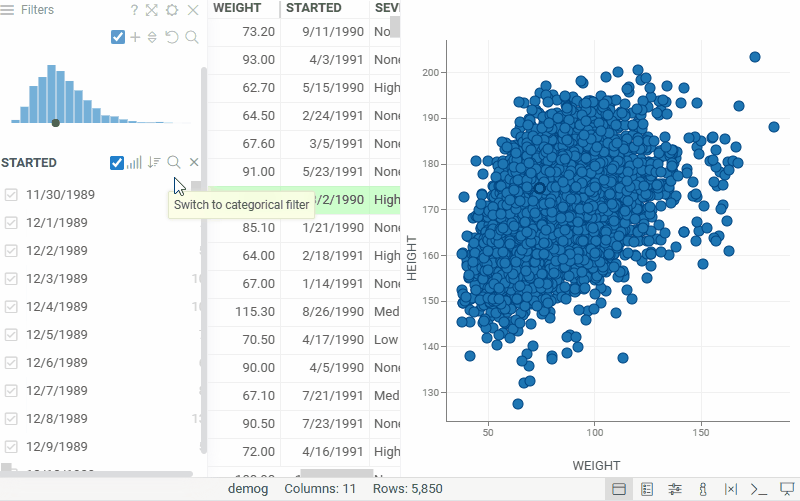 |
| In-viewer filter: Edit filter expressions in the new Edit Formula dialog with real-time preview, autocomplete, and validation | 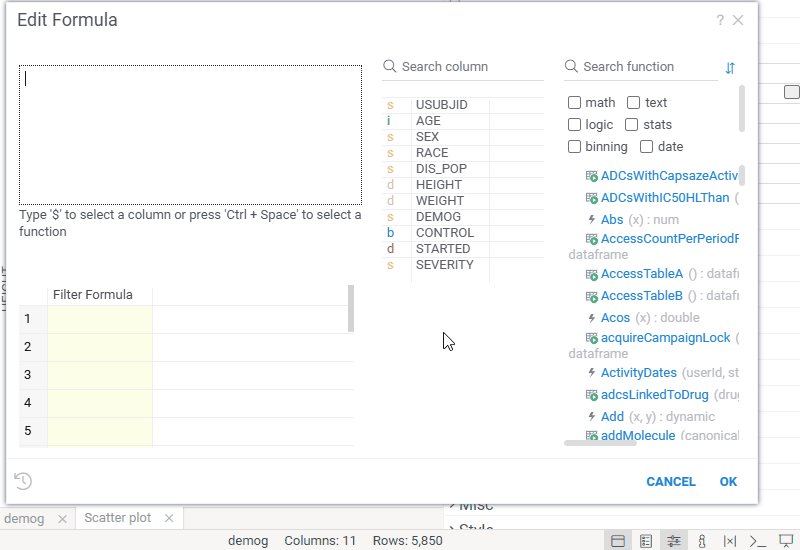 |
Developer updates
-
Breaking changes:
This release introduces non-backward-compatible database changes. After upgrading to 1.27.0 and migrating the database, older versions (including 1.26.8) will no longer work. Rolling back to 1.26.N requires manually reverting the changes or restoring a pre-upgrade backup.
JS API:- Renamed:
TableView.refresh→TableView.reloadData; viewer fieldsaveZoom→saveWithData - Removed: deprecated
fetchProxy(usefetchorgrok.dapi.fetchProxy) - Changed: canvas viewport accessors moved from
CanvasViewerMixintoCanvasViewportMixin; removed unnecessary fields fromIInputInitOptions - Pie chart: label properties restructured (
showValueadded; existing label properties renamed)
Packages: Function tags (such as
app,viewer,fileViewer,fileImporter,panel) are now migrated to themeta.roleproperty. If your package uses//tags:to declare function types, switch to//meta.role:instead. - Renamed:
Service compatible versions
| Service | Version |
|---|---|
| Grok Connect | 2.6.0 |
| Grok Pipe | 1.0.1 |
| Grok Spawner | 1.12.0 |
| RabbitMQ | 4.0.5-management |
| Jupyter Kernel Gateway | 1.17.0 |
1.26.7 || 2025-Nov
Developer updates
- Fixed Databrics schema browser
Service compatible versions
| Service | Version |
|---|---|
| Grok Connect | 2.5.3 or higher |
| Grok Pipe | 1.0.1 or higher |
| Grok Spawner | 1.11.7 or higher |
| RabbitMQ | 4.0.5-management |
| Jupyter Kernel Gateway | 1.16.2 or higher |
1.26.6 || 2025-Oct
Developer updates
- Added support for IAP short token format.
- Added the ability to move and copy files in Google Cloud Storage.
- Fixed:
- CSV parsing issue in Google Cloud Storage
- OpenID autologin behavior
- GPU machine selection priority for Docker containers
Service compatible versions
| Service | Version |
|---|---|
| Grok Connect | 2.5.2 |
| Grok Pipe | 1.0.1 |
| Grok Spawner | 1.11.7 |
| RabbitMQ | 4.0.5-management |
| Jupyter Kernel Gateway | 1.16.2 |
1.26.5 || 2025-Oct
Developer updates
- Added support for SAML authentication
- Introduced support for user account impersonation in Google Cloud Storage
- Projects: Added support for saving projects created via custom scripts with data synchronization
Service compatible versions
| Service | Version |
|---|---|
| Grok Connect | 2.5.2 |
| Grok Pipe | 1.0.1 |
| Grok Spawner | 1.11.4 |
| RabbitMQ | 4.0.5-management |
| Jupyter Kernel Gateway | 1.16.2 |
1.26 || 2025-Jul
Developer updates
- Breaking changes: This release introduces non-backward-compatible database changes. You can upgrade to version 1.26.0 automatically; however, once you migrate the database, older versions (including 1.25) will no longer be compatible. In case you need to roll back to 1.25.N, you must manually revert the changes or restore a pre-upgrade backup.
1.25 || 2025-Mar
Navigation and usability
| Smarter file viewers: Previously, viewer selection was based solely on file format (e.g., XLSX). Now, Datagrok also analyzes file content to choose the appropriate viewer. For example, XLSX files with regular data open in the table view, while XLSX files with plate-like content open using the plate reader | 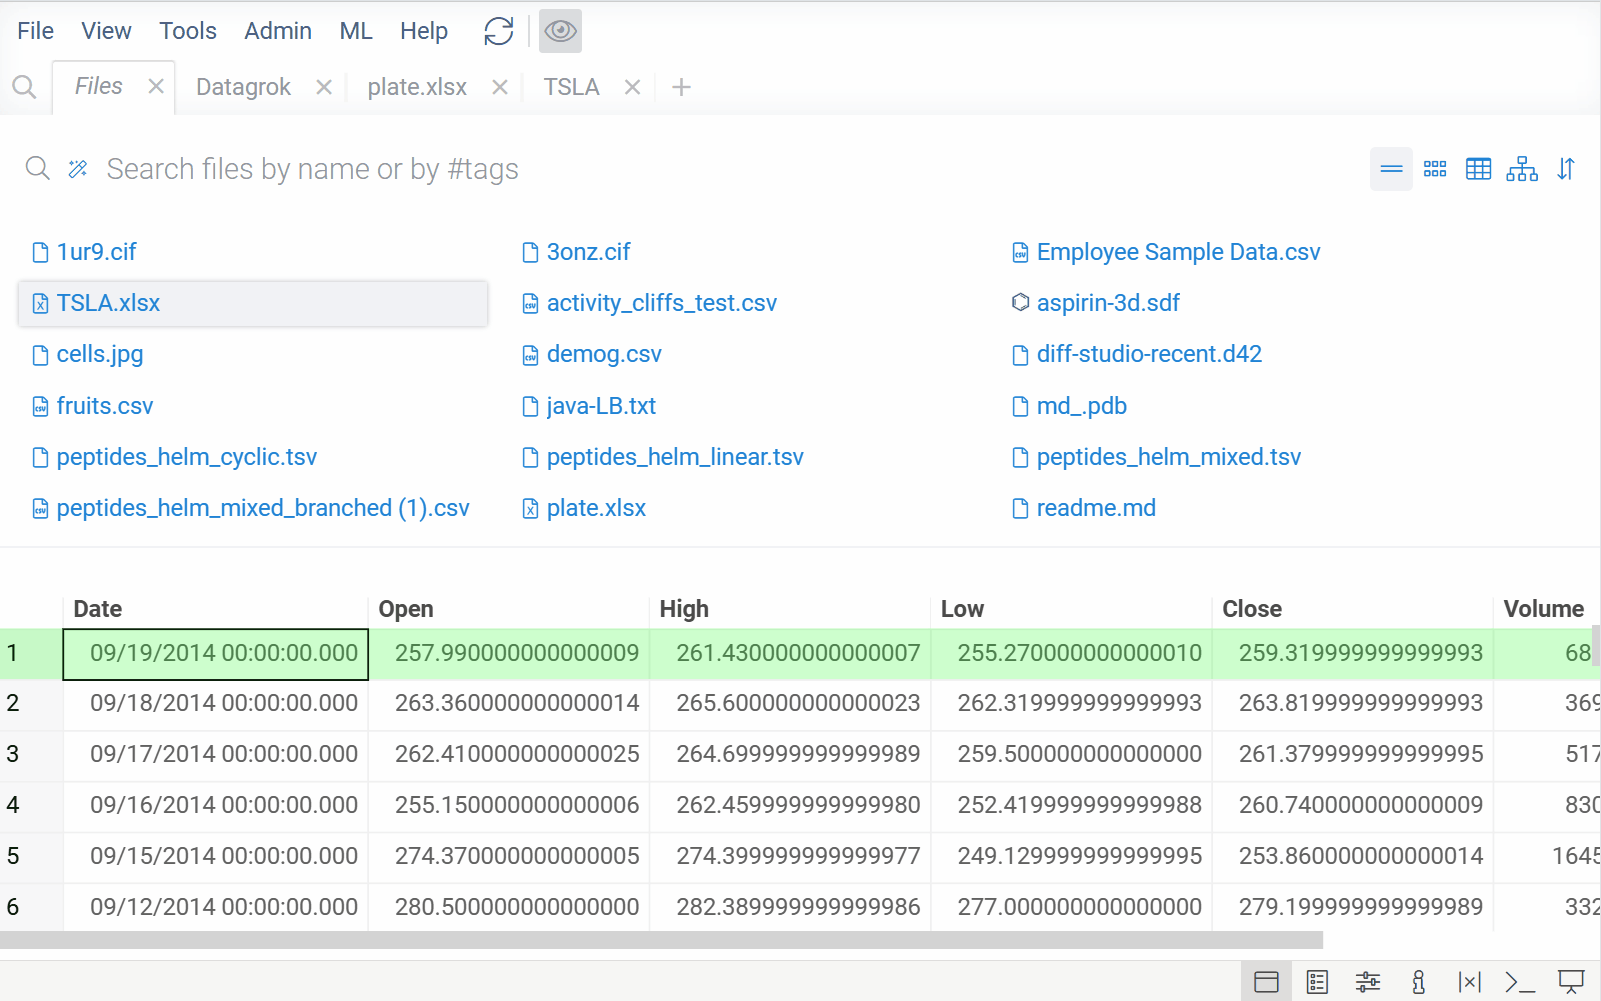 |
Developer updates
- Breaking changes: Site markup, UI API, and CSS styles have been updated. If your packages or integrations rely on specific UI elements or styling, it is recommended to check for compatibility and make the necessary adjustments.
1.24 || 2025-Feb
Visualization and analysis
| Grid: Rows and columns now resize together when you change row heights. This creates a zoom effect, where cell content adapts for optimal viewing. Zooming out shows the big picture. Zooming in shows details. This works especially well with dynamic content like proteins, user profiles, forms, and JIRA tickets. | 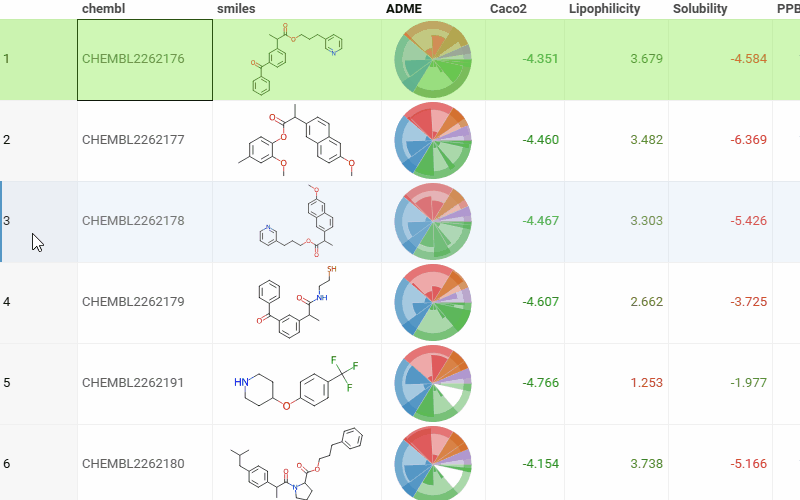 |
| Grid: We now support right-click panning. Hold the right mouse button to drag and move around your data. This feature is particularly useful when exploring extensive datasets in the zoomed-out mode. |  |
| Grid: You can now create column groups | 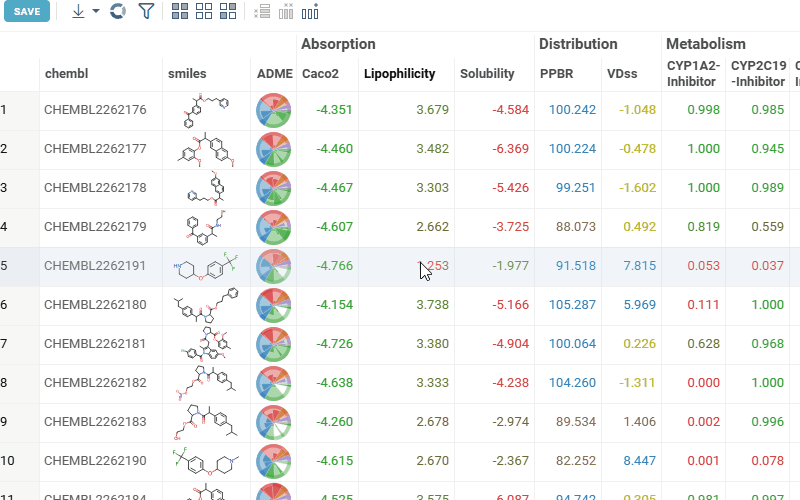 |
| Grid: You can now easily (un)hide columns | 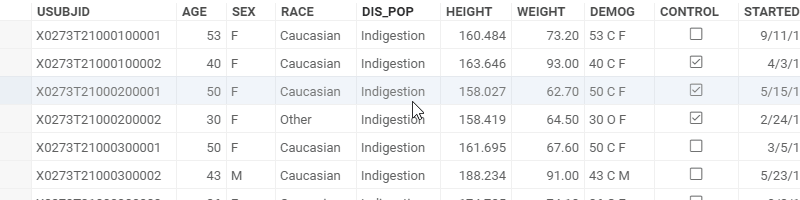 |
| Cell renderers: Tags cell renderer now works with boolean columns (previously, it required comma-separated values) | 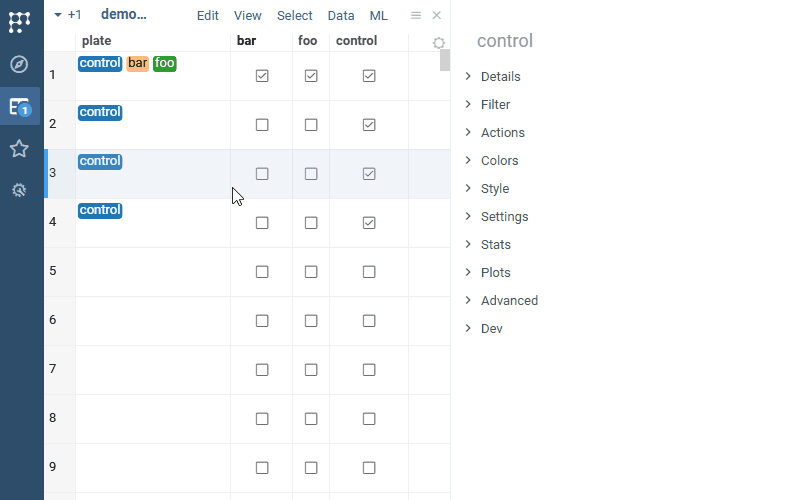 |
| Cell renderers: Sparklines now support multiple normalization options - by row, column, or global values | 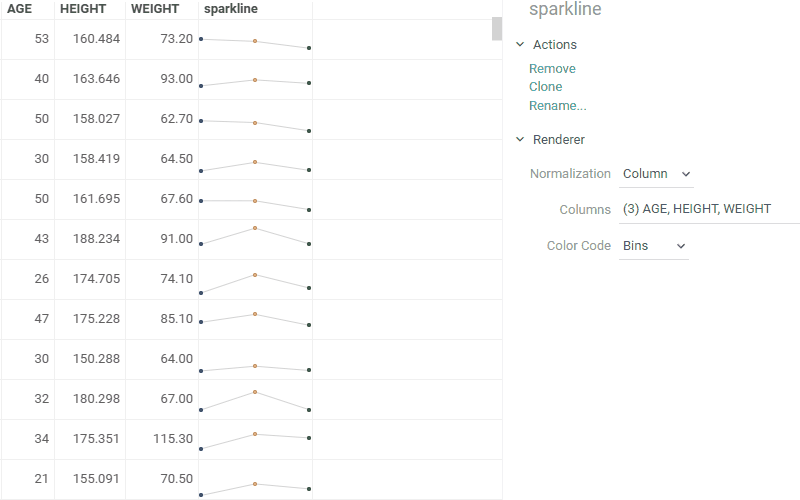 |
| Cell renderers: We now support adaptive rendering of files in cells |  |
Developer updates
JS API changes:
- New features:
- Classes: 0
- Functions: 10
- Breaking changes
1.23 || 2024-Dec
New tools and apps
| Pyodide: Run Python in the browser | |
| Admetica: Predict, visualize, and analyze 20+ ADMET properties using Datagrok's open-source ADMET predictor Learn more |
Data access and management
| New Visual Query Builder: Seamlessly join tables, aggregate, and pivot from one user interface |
Visualization and analysis
| Grid: Group multiple columns together and apply style for multiple columns at once | 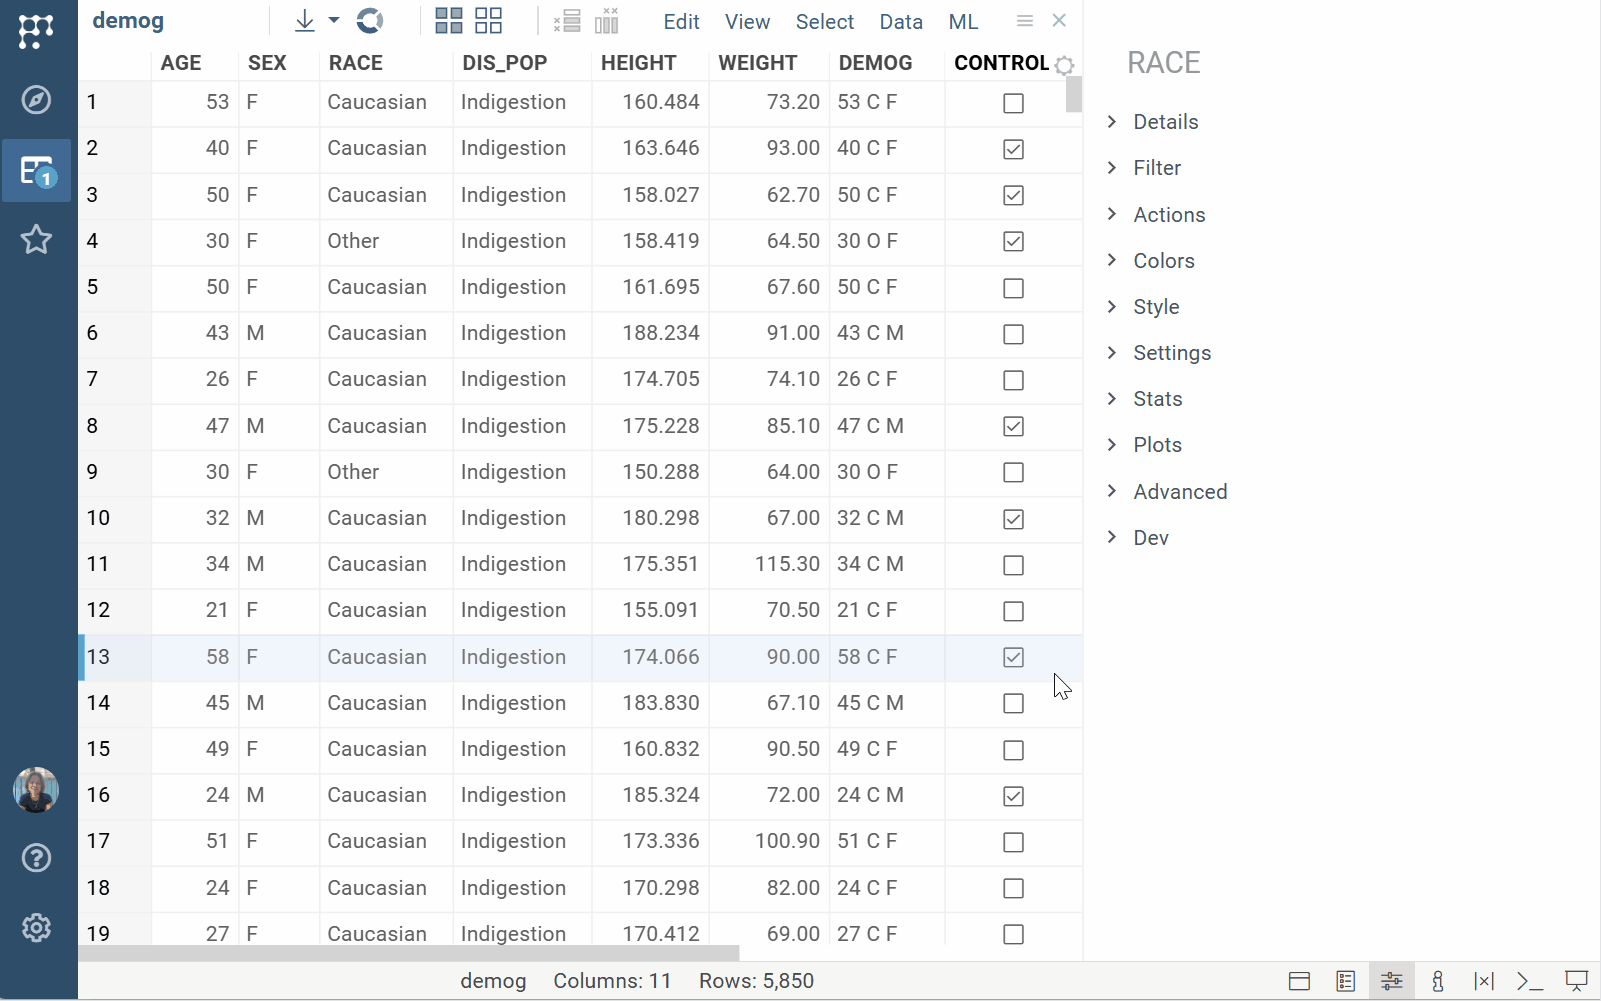 |
| Scatterplot: |
Developer updates
JS API changes:
- New features:
- Classes: 1
- Functions: 0
- Breaking changes
1.22 || 2024-Nov
Data access and management
| Custom identifier registration: Register custom identifiers (e.g., compound IDs) to search, link, and analyze entity data across the platform Video demo Developers: Learn more |  |
| Search integrated functions: Annotate queries and other functions with search patterns to display results when users search with matching terms Learn more |  |
| Plugin databases | You can now ship a Postgres database (such as chemical registration system) with your plugin |
Visualization and analysis
Scatterplot
| New data series connection lines let you track datapoint relationship over time Learn more | 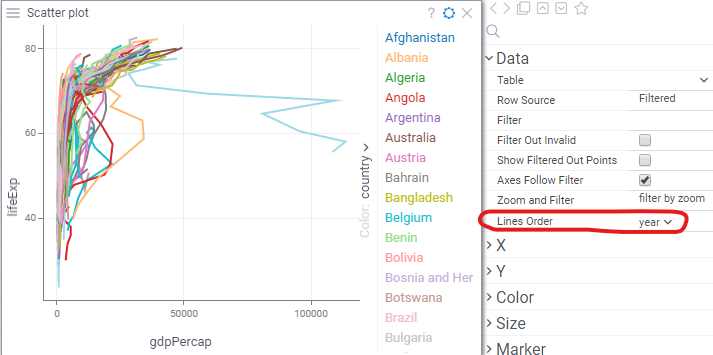 |
Platform performance
- Pyodide integration: you can now run Python functions, including data transformation steps, directly in the browser
- Improved automated data cleanup: keeps the server lean by deleting old data and logs (could be configured)
1.21 || 2024-Sep
This version requires a database migration that cannot be rolled back. Once you upgrade to version 1.21.0, you cannot downgrade. If you need assistance, contact Datagrok Support.
Data transformation
We improved the calculated column feature (requires a PowerPack package):
- Usability: Drag-and-drop, search, and function suggestions in Add New Column dialog
- Formula assistance: Real-time validation, syntax highlighting, autocompletion hints
- Extended functions: Added package-specific function support
ML & modeling
We continue to improve ML capabilities within the platform. We added:
- New interactive model training dashboard
- Binary classification support with prediction threshold control
- AUC-ROC visualization
- Model comparison tools
- Automatic model selection
- New algorithms (EDA package):
- Softmax classifier
- XGBoost tools
- Partial least squares regression
Other
- File caching is now enabled by default. It works automatically without the need for configuration.
1.20 || 2024-Jul
New tools and apps
| Tool / App | Purpose | Requirements | Learn more |
|---|---|---|---|
| Dimensionality reduction using WebGPU | Run dimensionality reduction on 100K molecules in less than 10 seconds | EDA package | Video walkthrough Wiki page |
| Diff Studio | App that turns differential equations into interactive visual models | Diff Studio package | Launch app Wiki page |
ML & modeling
We continue to improve ML capabilities within the platform:
Improved in-platform model training:
- Automatic input substitution for models
- Interactive hyperparameter tuning
- New interactive visualization widgets for model performance evaluation
MLflow integration (learn more):
- Import and apply MLflow predictive models directly to Datagrok datasets
- Streamlined model management:
- Automatic MLflow model fetching
- Input annotation via MLflow tags
- MLflow models inference support
Platform performance
We've introduced caching for file shares (including S3, Azure, and local storage):
- Faster file retrieval and display in Browse
- Entirely browser-based cache, eliminating server requests
- Configurable caching for individual files and file shares
- Automatic cache invalidation when files are modified within the platform
1.19 || 2024-Jun
Visualization and analysis
| Organize and filter hierarchical data: | 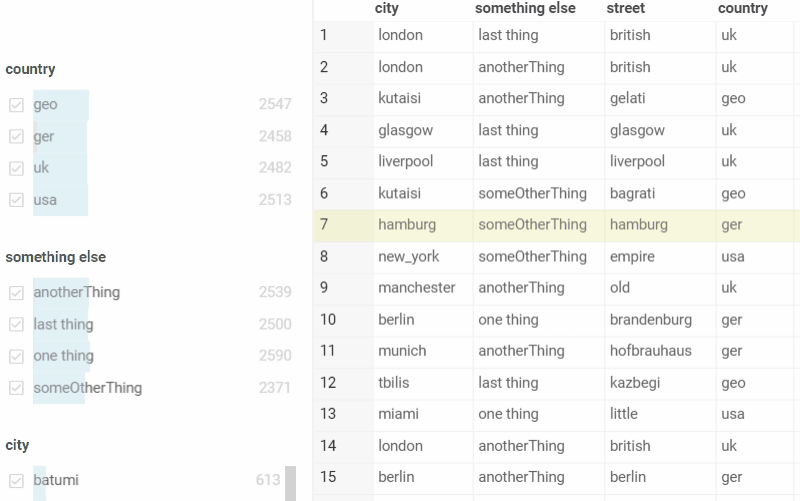 |
Create custom filters using expressions:>, contains, or regex |  |
| Highlight text matches in cells with free-text mode | 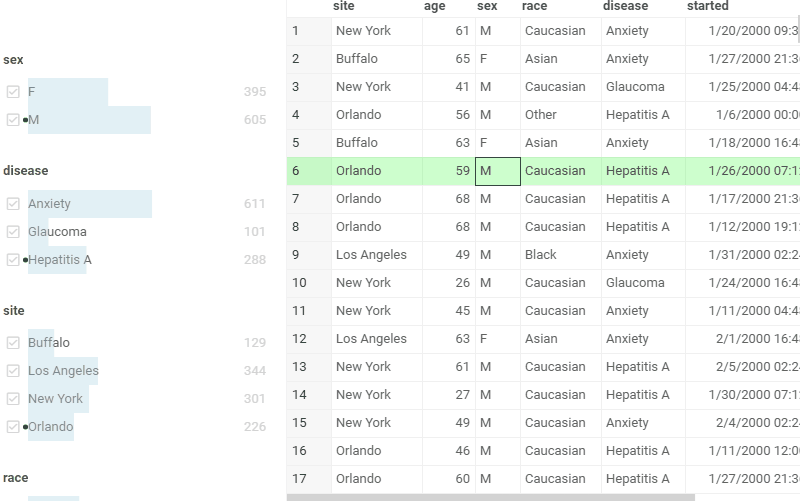 |
Other
- Added new connectors: Azure Blob, SharePoint
- Enhanced CSV export options for dataframes and views:
- Preserve row and column order when exporting
- Export molecules as SMILES strings
- Selectively export visible columns only
- Configure column qualifiers for improved data formatting
Developer updates
You can now integrate with Datagrok using Datagrok's REST API:
- Supports operations on files, tables, dashboards, and functions
- Allows for programmatic data management, dashboard creation, and function calls
- Python client library available for simplified API interaction
1.18 || 2024-Mar
New tools and apps
| Tool / App | Purpose | Requirements | Learn more |
|---|---|---|---|
| Matched Molecular Pairs | Tool for analyzing how structural changes affect molecular properties and activity | Chem package | Interactive demo Wiki page |
| Docking | Tool for screening ligand libraries against AutoDock-prepared targets | Docking package | Interactive demo GitHub |
| Hit Design | App for collaborative hit design | HitTriage package | Launch app GitHub |
| Hit Triage | App for collaborative hit assessment and prioritization | HitTriage package | Launch app GitHub |
Navigation and usability
| New Browse view: Navigate the tree to access, preview, and manage anything in Datagrok, all from one convenient location. Learn more |  |
Data access and management
| Add custom metadata to anything - molecules, experiments, or users Learn more |  |
Visualization and analysis
Cell renderers
| New cell renderers: |  |
Trellis plot
| Trellis plot now supports sparklines |  |
Developer updates
- Computation queue
- Harmonized inputs and properties
- Major scripting Platform performance improvements
- CVM: CUDA support
- Push notifications
- Refactor package update mechanism
- JS API for viewer events
1.17 || 2023-Oct
Visualization and analysis
Grid: Pinned rows
| Pin rows and save pinned view to the layout or project Learn more |  |
Grid: Column selection
| Hold Shift and drag the mouse over the column headers |  |
Grid: Column navigation
| In the Column Manager: |  |
Grid: Summary columns
(From PowerGrid package) |  |
Grid: Linked tables in cells
| Link tables and show data from one linked table in another |  |
Line chart: Split by category
| Split line charts by multiple categorical columns |  |
New info plane: Plots
| Automatically visualizes selected columns for quick profiling (Context Panel > Plots) Learn more | 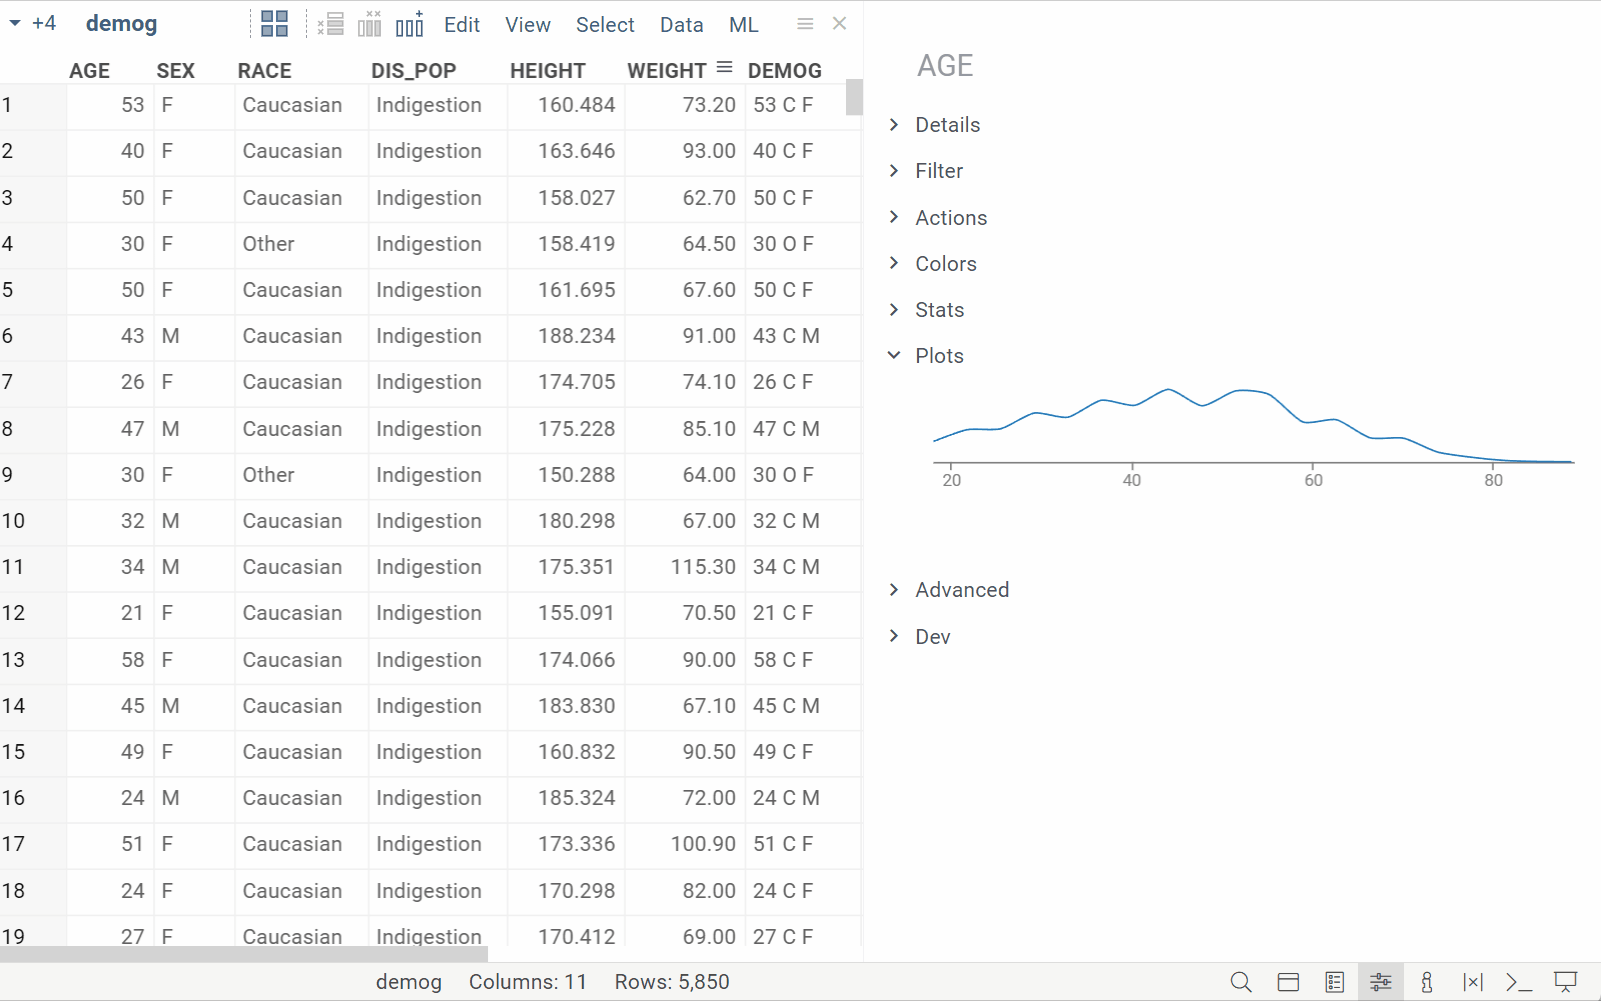 |
New info pane: Content
| Displays details for the selected rows in a tabular format (Context Panel > Content) | 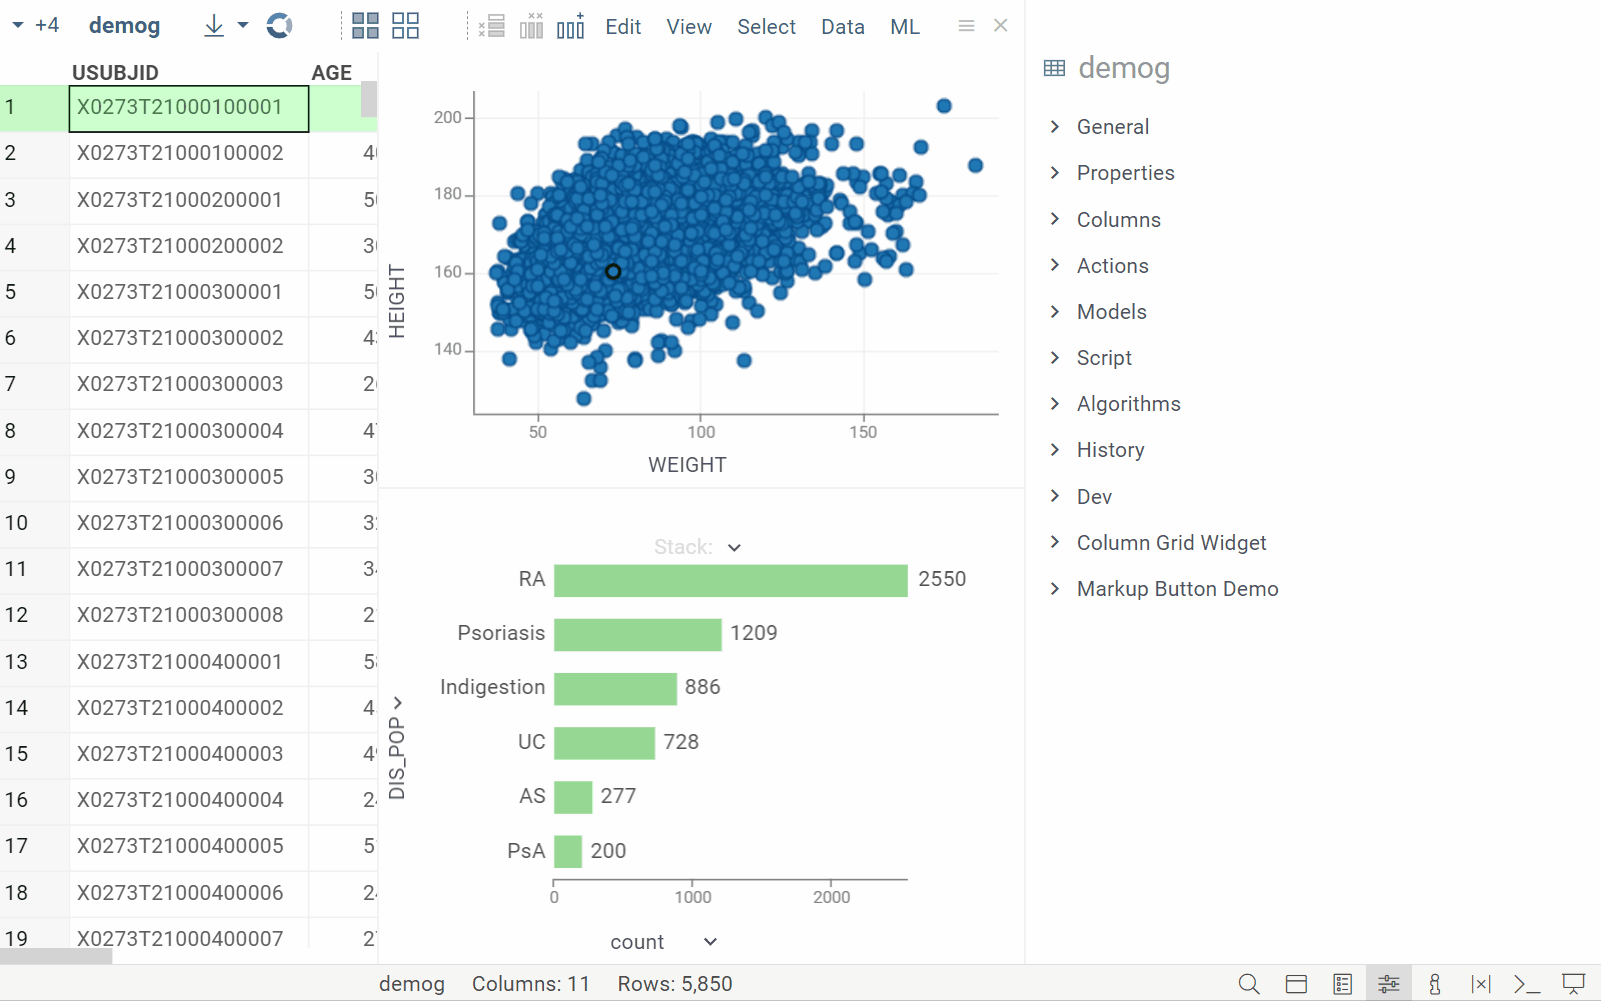 |
Platform performance
We now support client and server-side caching for function results. This feature is particularly useful for functions that produce consistent outputs, like queries and scripts. The client-side cache, limited to 100 MB or 100,000 records, speeds up data access and improves network efficiency. The unrestricted server-side cache improves response times and overall server performance. Together, these caching mechanisms provide a smoother and more responsive platform experience.
Platform administration
- New installation wizard for platform configuration during deployment
- Authorization with Okta
- Amazon CloudWatch log export improvements
Developer updates
Auto-fill function parameters
| Auto populate function input parameters based on a chosen key, such as selecting a car model to instantly fill in details like its mileage and engine size Learn more | 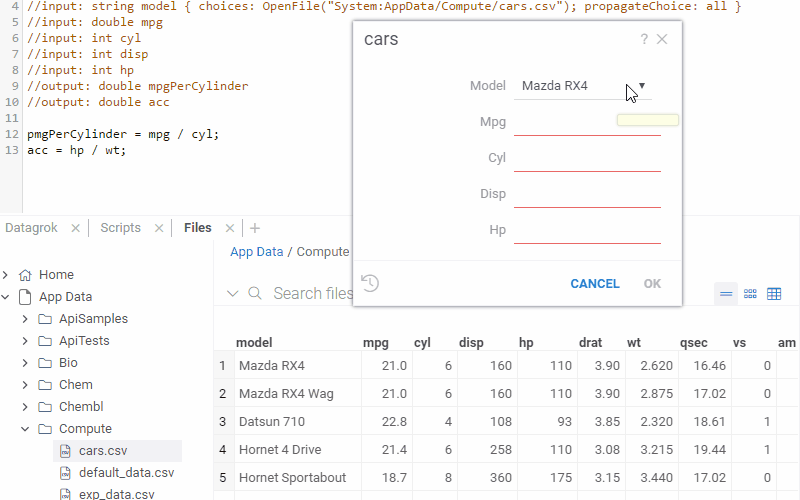 |