Visualize output data
Add viewers for dataframe
You can specify viewers to review output dataframes in a human-friendly way. Each dataframe parameter may have a list of viewers.
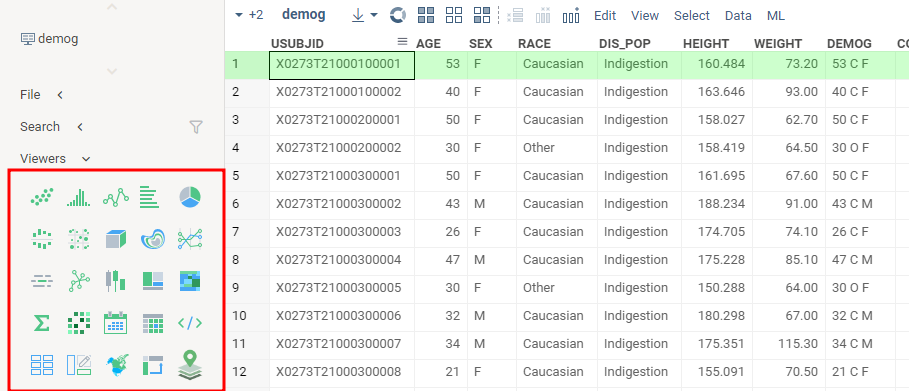
To see all available viewers, open the demo dataframe and expand the toolbox on the left.
Fantastic viewers and where to find them
The following code adds Scatter plot
and Line chart viewers on the input dataframe.
- Result
- Code
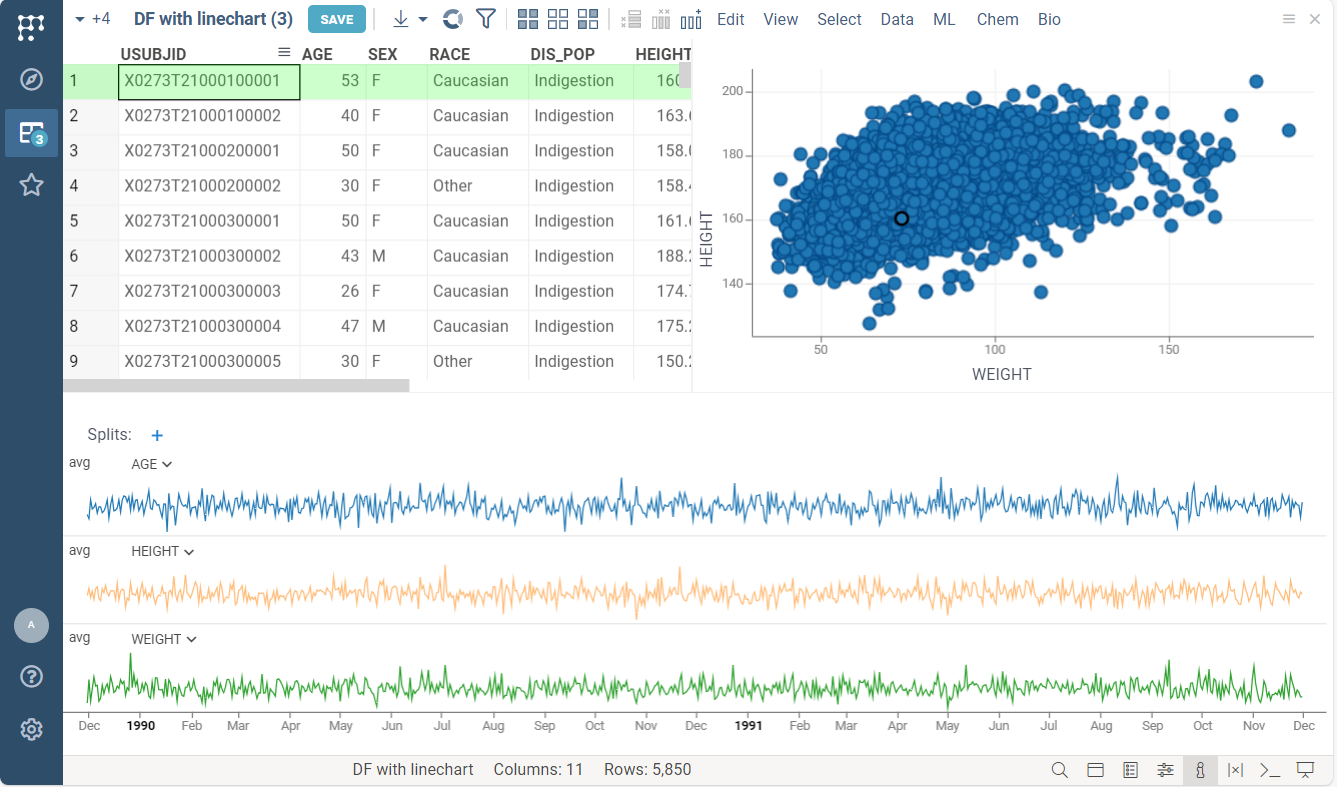
#name: Adding viewer on output dataframe
#language: python
#sample: demog.csv
#input: dataframe inputDF
#output: dataframe outputDF { viewer: Line chart | Scatter plot }

outputDF = inputDF.copy()
Where viewers appear
The viewers appear wherever the result opens:
- In the function view, with the results, after you run the function.
- In the table view that opens for the result, for example when you run a script from the Scripts browser.
- In the workspace, when you add a result table with Add to workspace (+) in the function view: the copy shows the viewers as you arranged them in the view. Save there offers the result tables, arranged the same way, and the input tables as a new project; the saved project reruns the function with the same inputs when you open it.
Input dataframes can have viewers too. In the function view, they appear above the results, so the page reads as the form, the table it received, and what came out of it:
#input: dataframe inputDF { viewer: Scatter plot | Grid }
If you close a viewer in the results, press Ctrl+Z to bring it back to the same place.
The function view keeps the viewers as you arranged them: when you run the function again, a
viewer you added, moved or closed stays that way, and the declared viewer: list is used only for
the first run, or when the new result has different columns. Once you change an input, the results
dim under "Inputs changed. Press RUN to update the results." until the next run, unless the
function reruns on every input change (runOnInput).
Run history
Every run you make in the function view is recorded on the server: who ran it, when, with which
inputs, and its scalar results. The result header shows the run's number (Run #12), and the
history icon on the ribbon opens the run history: the function's runs, newest first, with a
search over titles, inputs and authors, and filters for your own and starred runs.
- Click a run to bring its inputs back into the form and its results below, at the run's own
address (
/func/Name/runs/N, see stored runs). - Star a run to keep it whole: its result tables and table inputs are uploaded, so the run reopens with its tables for anyone, from the history or from its link. An unstarred run keeps its inputs and scalar outputs; opening it offers RUN to recompute the tables.
- The pencil next to the run number, or Edit... in the run's context menu, gives it a title, description and tags; this keeps the run's tables as well.
- Check two or more runs and press Compare for a table with one row per run: number, time, author, inputs and scalar outputs.
- You can delete your own runs from the context menu. Runs never expire otherwise.
Runs of queries, scripts and server functions are recorded by the server wherever they start.
Runs of client-side functions, such as JavaScript package functions, are recorded when started
from the function view or a /func/ link, not from code.
Customize viewers for dataframe
Each viewer has a list of customizable properties. They control how the viewer is rendered and how it behaves. For instance, you can specify the dataframe column used as the X-axis on the scatter plot.
The list of available properties differs for each type of viewer.
Right-click the viewer and select Properties in the context menu.
In the viewer tag, you can specify any property listed in the opened property panel.
You should enter the viewer property in camelCase format.
For example, here "Show regression line" property
of the scatterplot becomes showRegressionLine.
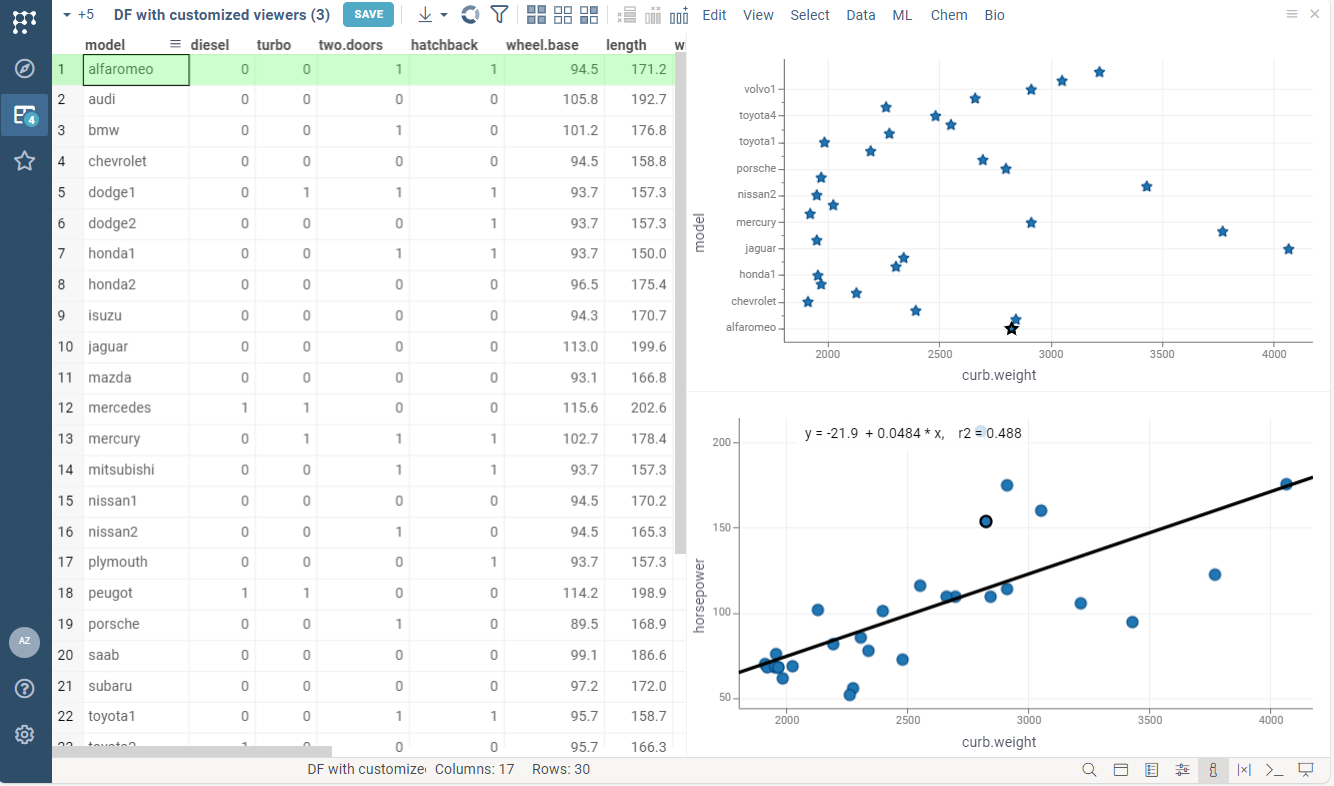
For example, the following code:
- specifies marker type and size for linechart
- enables regression line rendering for scatterplot
- Result
- Code
#name: Viewers customization
#language: python
#sample: cars.csv
#input: dataframe inputDF
#output: dataframe outputDF { viewer: Scatter plot(y: "model", markerType: star, markerSize: 15) | Scatter plot(showRegressionLine: true) }

outputDF = inputDF.copy()
A few shortcuts and rules apply to the values:
- Column properties take the short name:
x: timesets the X column (xColumnName), andy: temperaturesets the Y column. titlesets the viewer title:Scatter plot(title: Growth over time).- Numbers and booleans are written as is, including decimals and negatives:
xMax: 25.5,yMin: -1,showRegressionLine: true. - Quote a value that contains a comma, a semicolon, parentheses, or a vertical bar:
title: "Growth (mg/L)". - Viewers from packages take options the same way, for example
Forms(colorCode: false).
Arrange viewers
By default, the viewers are docked next to the table's grid. To lay them out yourself, give each
viewer a block: its share of a row, in percent. A row fills up to 100, and the next viewer starts
a new row. Rows share the height equally.
#output: dataframe result { viewer: Line chart(block: 60) | Scatter plot(block: 40) | Bar chart(block: 50) | Grid(block: 50) }
This puts the line chart and the scatter plot in the first row, 60/40, and the bar chart and the grid in the second row, 50/50.
To place the grid, list it like any other viewer, as in the example above. If you leave it out, the grid takes the rest of the last row, or a row of its own when the last row is full.
block applies to the platform's function view and table views. The
rich function view editor arranges viewers with its
own options.